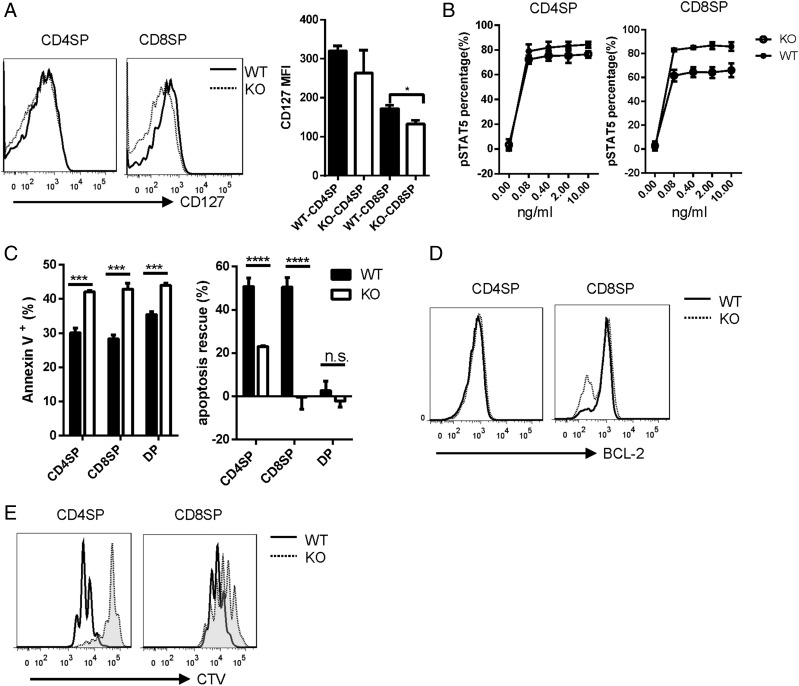
FIGURE 5.
Compromised IL-7 signaling in Ubc9-deficient CD8 SP cells. (A) Flow cytometry analysis of IL-7Rα (CD127) expression on CD4 SP or CD8 SP cells. MFI, mean fluorescence intensity (WT, n = 3; KO, n = 3). (B) CD4 SP or CD8 SP cells were stimulated with indicated concentration of IL-7 for 15 min, and STAT5 phosphorylation was analyzed by Phosphoflow. The percentage of p-STAT5 is shown (WT, n = 3; KO, n = 3). (C) CD4 SP, CD8 SP, or DP cells were sorted by FACS and cultured in medium for 18 h. Annexin V was stained to detect the apoptotic cells (left). A total of 10 ng/ml IL-7 was added to rescue the apoptotic cells, and the rescue percentage was shown (right) (WT, n = 3; KO, n = 3). (D) Flow cytometry analysis of BCL-2 expression in CD4 SP or CD8 SP cells (WT, n = 3; KO, n = 3). (E) FACS sorted CD4 SP or CD8 SP cells were labeled with CellTrace Violet (CTV) and cultured with plate-coated anti-CD3 and anti-CD28 for 3 d; dye dilution was detected by flow cytometry. (A–E) WT, Ubc9fl/fl; KO, Ubc9fl/fl Cd4-Cre. These are the representative data of at least three experiments. Asterisks denote statistical significance compared with the indicated controls: *p < 0.05, ***p < 0.001, ****p < 0.0001.

