Fig. 4.
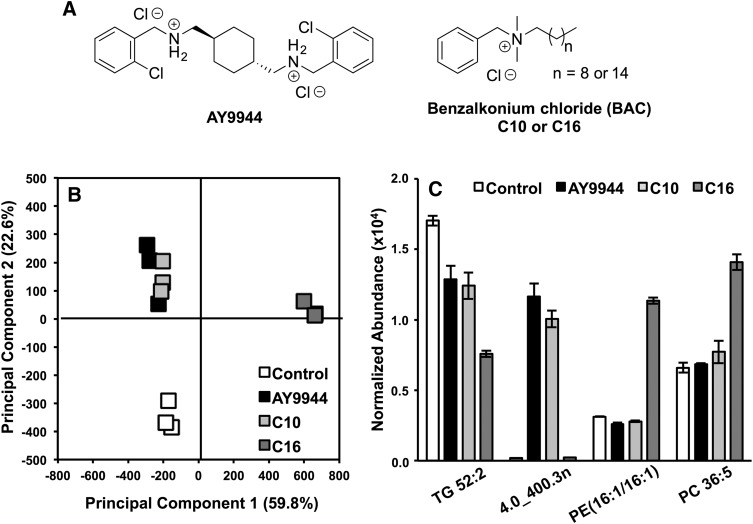
Results from lipidomic analysis of Neuro2a cells exposed to AY9944, BAC-C10 (C10), and BAC-C16 (C16) (A). (B) In the PCA, treatment groups separate from controls along PC2, and BAC-C16 is separated from AY9944, BAC-C10, and controls along PC1. (C) Group separation in the PCA is the result of molecular features such as TAG 52:2, PE (16:1/16:1), PC 36:5, and an unknown feature 4.0_400.3n. N = 3 for each condition.

