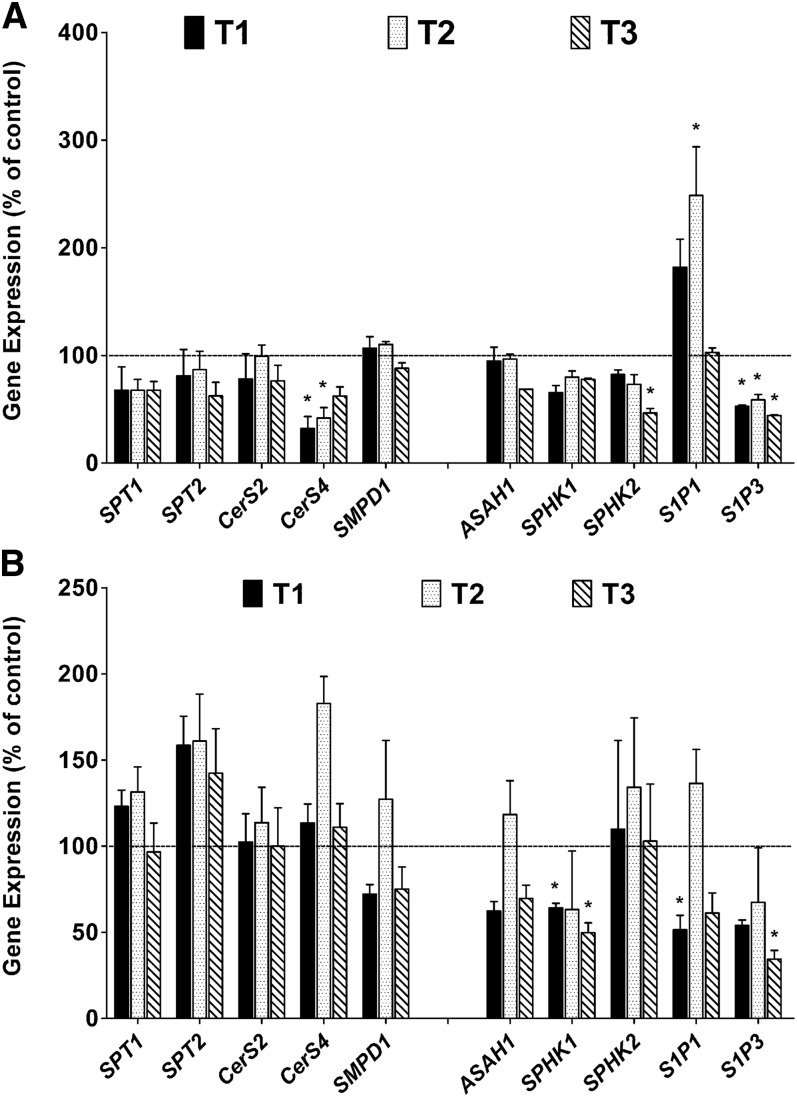
Fig. 6.
Alteration in SPL metabolic genes in HCFs (A) and in HKCs (B) treated with three isoforms of TGF-β (T1, T2, and T3). Expression of the genes presented in Fig. 5 was compared between untreated and treated HCFs (A) and HKCs (B) with either T1, T2, or T3. Expression values are presented relative to the untreated controls (controls = 100) (*P ≤ 0.01, n = 4).

