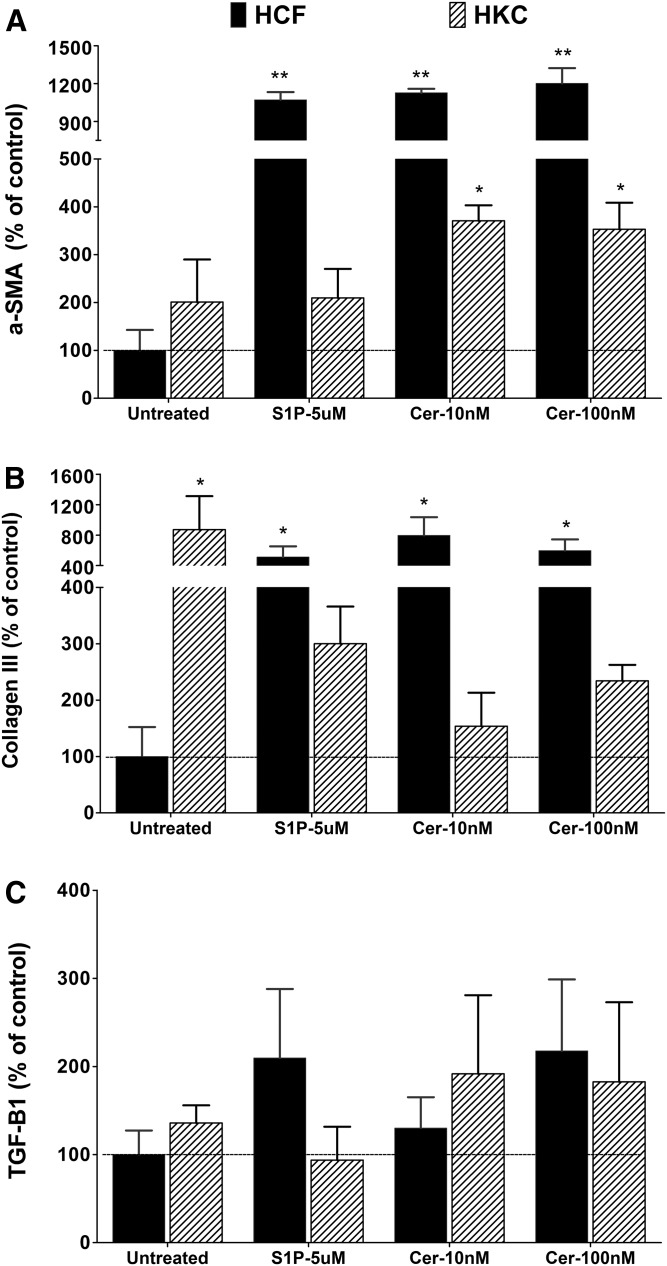
Fig. 7.
Expression of fibrosis marker proteins in cultured HCFs and HKCs treated with S1P and Cer. Expression of aSMA (ACTA2) (A), collagen-III (B), and TGF-β1 (TGF-B1) (C) were determined by Western blotting and the levels were determined by densitometric analysis using GAPDH as control. Expression values are presented relative to the untreated control (HCFs = 100). * P < 0.01 (n = 4) and ** P < 0.001 (n = 4) indicate the statistically significant difference from the untreated HCF.

