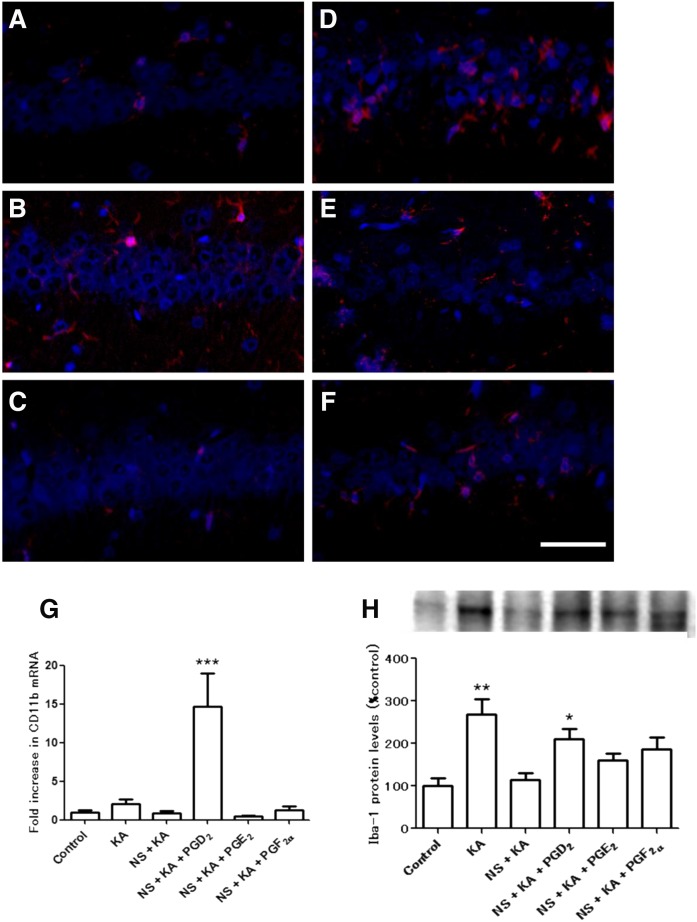
Fig. 4.
Immunofluorescence staining, mRNA expression, and protein levels of microglial marker. Iba-1 staining of control (A), KA (B), NS + KA (C), NS + KA + PGD2 (D), NS + KA + PGE2 (E), and NS + KA + PGF2α (F) groups is shown. G: The mRNA expression levels of CD11b relative to PGK1 in the hippocampus after 30 days of KA exposure, as determined by real-time PCR. H: The protein levels of Iba-1 in the hippocampus to 30 days after all of the reagent administration. Data are means ± SEM. Statistical analysis was performed by using one-way ANOVA followed by posthoc Newman-Keuls test. * P < 0.05; ** P < 0.01; *** P < 0.001 vs. control. Scale bar, 50 μm.

