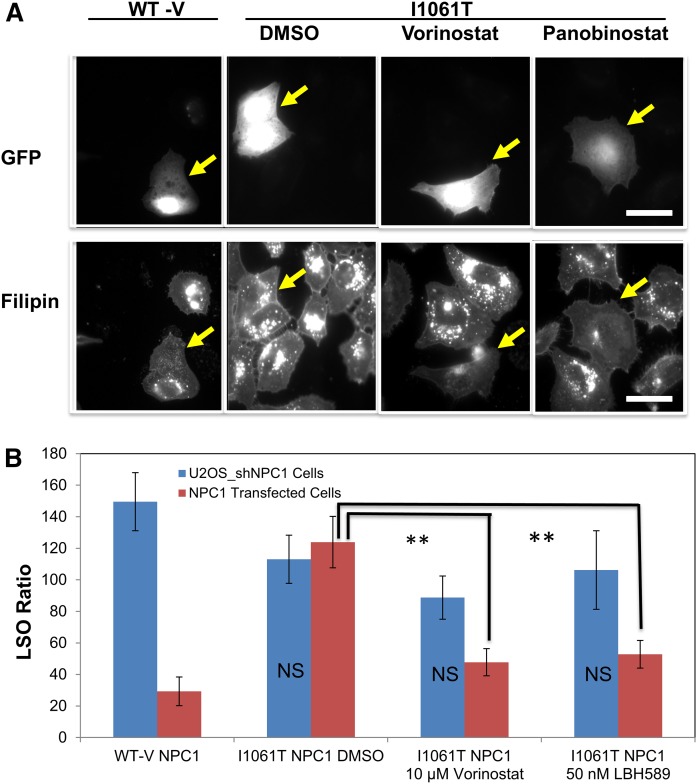
Fig. 5.
Illustration of the screening system. A: Representative images of transfected cells. At 24 h after transfection with a bicistronic vector containing eGFP plus WT-V-NPC1 or NPC1I1061T, U2OS-SRA-shNPC1 cells were treated with vorinostat (10 µM), panobinostat (50 nM), or DMSO solvent control for 48 h. Cells were treated with 50 µg/ml AcLDL for the final 2 h, fixed with PFA, and stained with filipin. Images were acquired on a Leica wide-field microscope using standard GFP and A4 filters. Transfection with WT NPC1 reduced the cholesterol accumulation, but transfection with NPC1I1061T did not, unless they were treated with an HDACi. Scale bar 10 μm. B: Quantification of filipin in transfected cells. Cholesterol accumulation in LSO of GFP-positive cells was measured based on filipin fluorescence, and the LSO values are shown. As described in Materials and Methods, images were obtained from 216 fields in three experiments for each condition. Between 40 and 120 of these images had GFP-labeled cells, and the LSO value was obtained for each of these images. In each experiment, the LSO values were normalized to the solvent-treated control. These normalized LSO values were used for statistical analysis. Error bars show SEM. ** P < 0.01.

