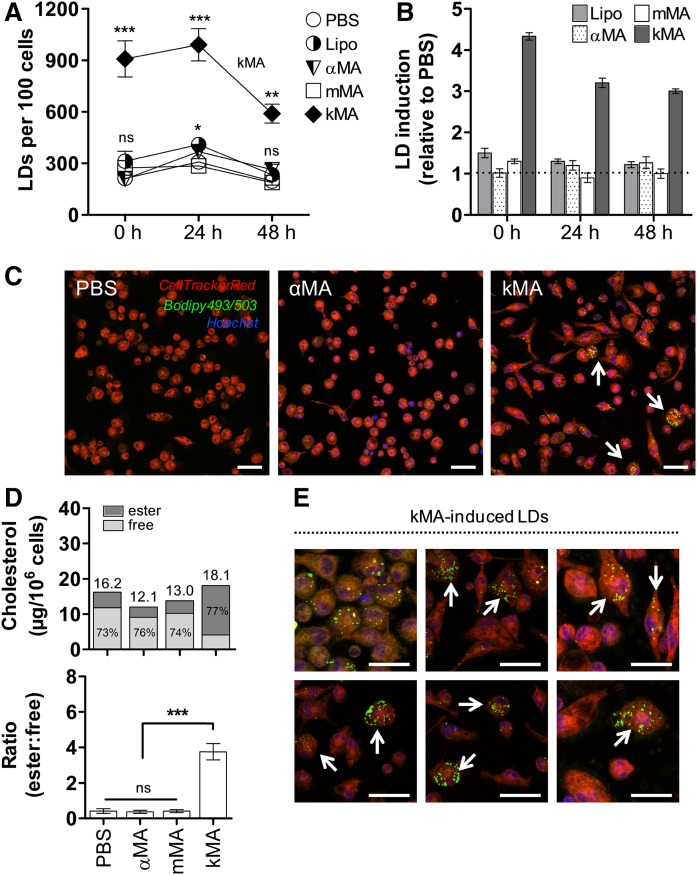
Fig. 3.
MAs of the keto oxygenation class induce foam cells rich in cholesterol-laden LDs. The induction of LDs is shown for peritoneal macrophages from control (PBS and Lipo) and αMA-, mMA-, and kMA-treated mice (mean ± SEM). A: LD accumulation in murine macrophages harvested at specified time points following the control and various MA treatments (GLM: Wald chi-square = 353.662, P < 0.001, df = 14; n = 5 per time point). B: Relative induction of LDs over time as compared with PBS (broken line). C: Laser-scanning-confocal microscopy images depicting variation in LD induction for PBS, αMA, and kMA treatments. Arrows indicate LD-filled cells. D: Cellular cholesterol content of variously treated cells. Bars represent total cholesterol, subdivided in the amount of free and esterified cholesterol for each of the treatments (micrograms per 106 cells). Upper panel, fraction percentages of free and esterified cholesterol are shown in the bars (n = 12 mice; Shapiro-Wilk: W = 0.813, P < 0.05; Kruskal-Wallis: H = 24.726, P < 0.001, df = 3). Lower panel, the ratio of esterified-to-free cholesterol is given for the various treatments (Kruskal-Wallis: H = 26.554, P < 0.001, df = 3). E: kMA-induced LDs in peritoneal macrophages as identified by the neutral lipid probe, Bodipy® 493/503. C, E: Stacked images, 63× oil objective. Scale bar: 20 μm. Significant P values were ranked as *P < 0.05, **P < 0.01, and ***P < 0.001; ns, not significant.

