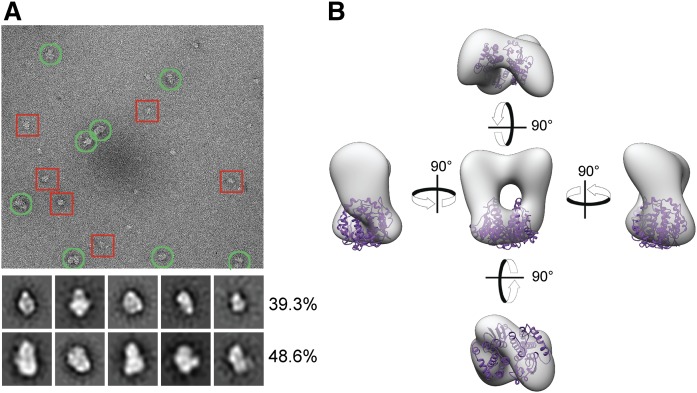
Fig. 7.
Evaluation of the oligomeric state of AWAT2 by EM. A: A representative cryo-electron micrograph of purified GST-AWAT2. The red squares indicate fusion protein monomers, whereas the green circles indicate fusion protein homodimers. The 2D classes shown were produced using the 1,603 particle dataset. The top row of classes represents fusion protein monomers, whereas the second row corresponds to homodimers. Each row is marked with the percentage distribution of each oligomeric state calculated from the 12,846 particle dataset. B: Three views of the 3D reconstructed density adjusted to a reasonable volume using the volume/mass conversion of 0.81 Da/Å. The crystal structure of GST (purple) is docked into the density using the Chimera fit to map function.

