Figure 2.
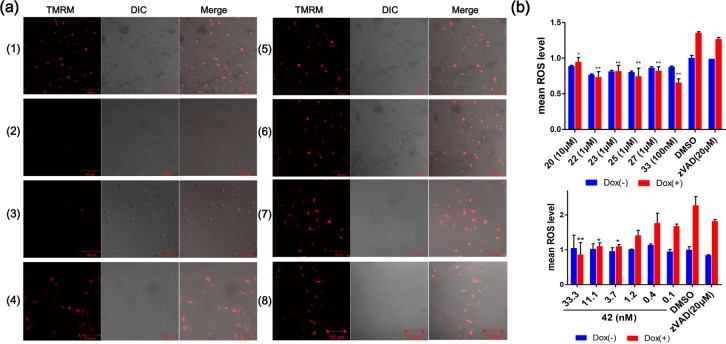
Mitochondrial protective effects of a series of apoptosis inhibitors. (a) TMRM staining of mitochondria in US2OS-Bim cells with (1) no apoptosis induction and treatment with DMSO, and with apoptosis inducted by the addition of DOX in the presence of the following treatments: (2) DMSO; (3) zVAD (10 μM); (4) compound 20 (10 μM); (5) compound 22 (1 μM); (6) compound 23 (1 μM); (7) compound 33 (100 nM); (8) compound 42 (3 nM). Scale: 100 μm. (b) Mean cellular ROS levels in U2OS-Bim cells with (red bars) and without (blue bars) Dox induced apoptosis under the indicated compound treatments. Top: ROS levels under treatment with various apoptosis inhibitor compounds, DMSO, and zVAD. Bottom: ROS levels under treatment with different concentrations of compound 42, DMSO, and zVAD (20 μM). The error bars represent the standard error of results from two separate experiments. P values are based on comparisons of each sample to the DMSO-treated apoptosis induction group. *: P < 0.05; **: P < 0.01; ***: P < 0.001.

