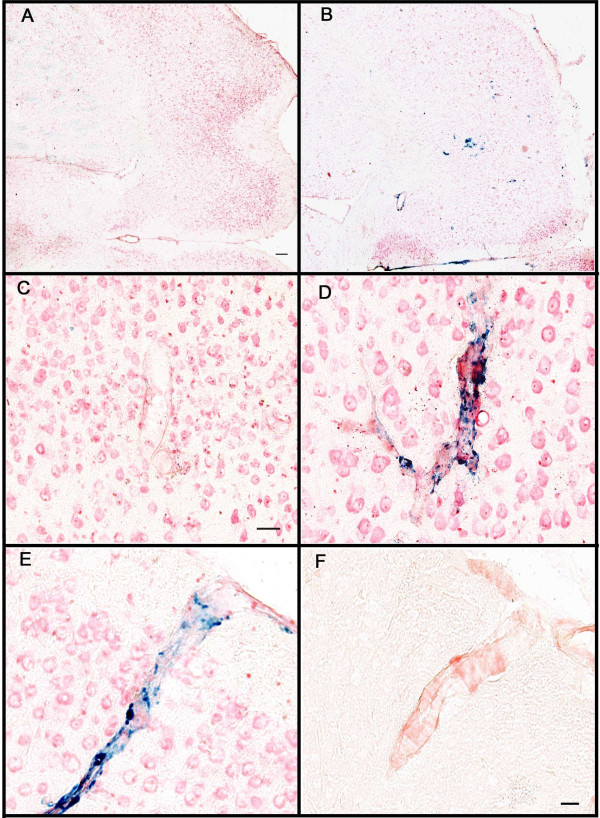
Figure 4.
Microhemorrhage associated with CAA following systemic administration of anti-Aβ antibodies. Panels A and B are low magnification images of the frontal cortex of APP-transgenic mice receiving either control antibodies (Panel A) or anti-Aβ antibodies (Panel B) for a period of 5 months. Panels C and D show representative images of amyloid containing vessels stained for Prussian blue (blue), counterstained with neutral red (red), from APP-transgenic mice receiving either control antibodies (Panel C) or anti-Aβ antibodies (Panel D) for a period of 3 months. Panel E shows a blood vessel in the frontal cortex stained for Prussian blue (blue), counterstained with neutral red, from an APP transgenic mouse administered anti-Aβ antibodies for 5 months. Panel F shows the same blood vessel on an adjacent section stained for Congo red, indicating that the blood vessel does in fact contain amyloid. Scale bar panel A = 120 μm for panels A-B. Scale bar panel C = 25 μm for panels C-D. Scale bar in panel F = 25 μm for panels E-F.

