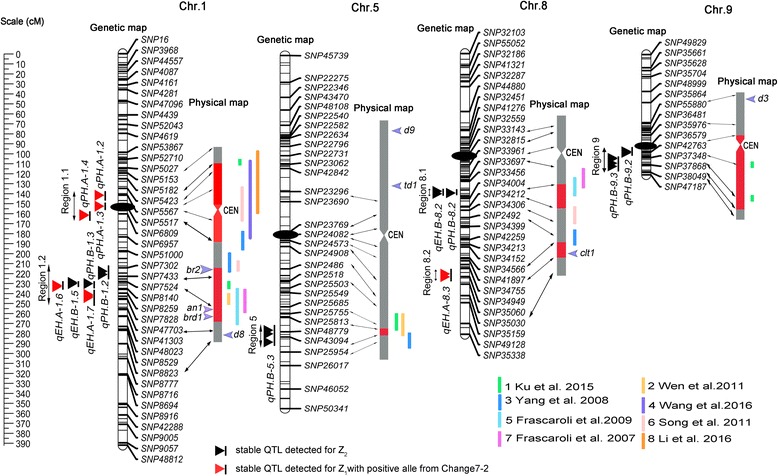
Fig. 2.

Genetic locations of the 14 environmentally stable QTLs for PH and EH. The centiMorgan (cM) scale is shown on the left. Black ellipses indicate the approximate positions of the centromeres. Vertical bars in black represent the confidence interval of each QTL. A black vertical bar with black triangle represents heterotic-related QTLs detected for Z2; a black vertical bar with a red triangle represents additive QTLs with positive alleles from parent Chang 7–2. Double-headed arrows represent the genomic regions characterized by QTL or QTL clusters. Red shadows on the physical map indicate the corresponding positions of each QTL. The verticals in different colors alongside the physical map indicate known heterotic-related QTLs from different studies (1 Ku et al. [43]; 2 Wen et al. [48]; 3 Yang et al. [45]; 4 Wang et al. [18]; 5 Frascaroli et al. [46]; 6 Song et al. [22]; 7 Frascaroli et al. [23]; 8 Li et al. [16]). The known positions of br2, an1, brd1, d8,d9, td1, clt1and d3 are presented in blue arrows
