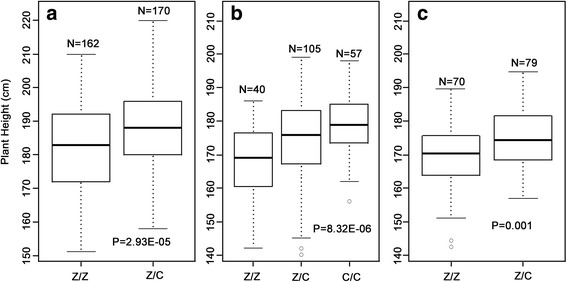
Fig. 3.

Validation of qPH.A-1.3 for plant height (PH) in a: BC2F1 population, b: BC2F2 population, c: BC3F1 population. The three populations were genotyped by using the SSR markers MPH72 and MPH1149. The distributions and mean values for PH are shown as different genotypic classes: Z/Z homozygous for Zheng 58 haplotype, C/C homozygous for Chang 7–2 haplotype, or Z/C for heterozygous
