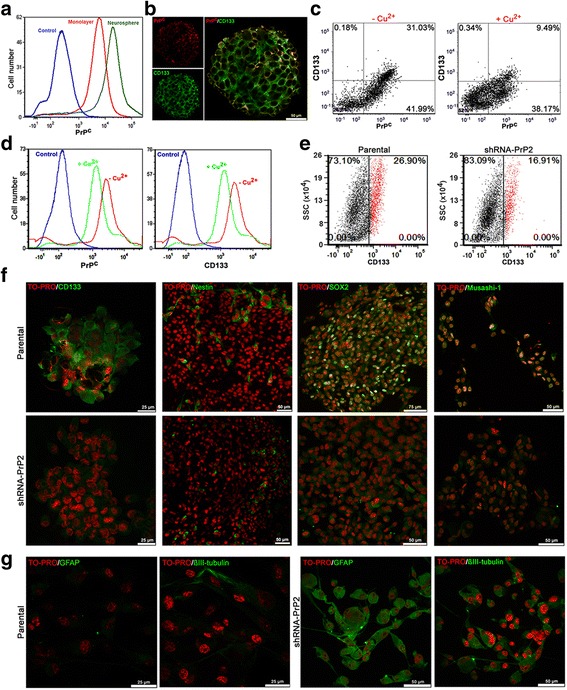
Fig. 2.

Stem cells marker expression in cellular prion protein (PrP C)-depleted neurospheres. a PrPC expression assessed by flow cytometry in parental monolayer (red) and neurosphere (green) cultures. Negative control shown in blue (only secondary antibody staining). b Immunofluorescence for PrPC (red) and CD133 (green) in parental neurospheres shows co-localization on the cell surface. c Dot plot of CD133 and PrPC expression in parental neurospheres in the absence (–Cu2+) or presence (+Cu2+) of CuSO4 250 μM. d Histogram for PrPC and CD133 in the absence (–Cu2+) and presence (+Cu2+) of CuSO4 250 μM. Negative control shown in blue (only secondary antibody staining). e Dot plot of CD133 expression in parental (left) and shRNA-PrP2 (right) neurospheres. CD133+ shown in red and CD133– shown in black. f Immunofluorescence for the stem cells markers musashi-1, nestin, Sox2, and CD133 (green) in parental (upper) and shRNA-PrP2 (lower) neurospheres. Nuclei staining (TO-PRO) shown in red. g Immunofluorescence for the cell differentiation markers GFAP and βIII-tubulin (green) in parental (left) and shRNA-PrP2 (right) neurospheres after 5 days of serum treatment. Nuclei staining (TO-PRO) shown in red
