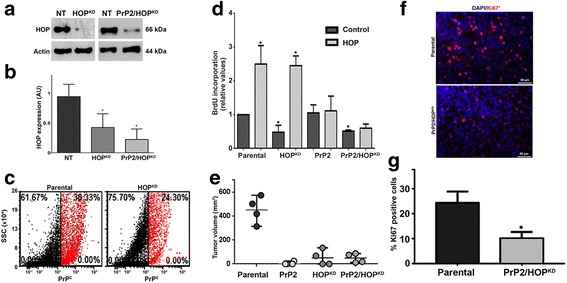
Fig. 4.

Cellular prion protein (PrP C) and/or Hsp70/90 organizing protein (HOP) knockdown suppresses cell proliferation and tumor growth in vivo. a Immunoblot for HOP expression in U87 non-target (NT), shRNA-HOP (HOP KD), or shRNA-PrP2/HOP (PrP2/HOP KD) populations. Actin was used as the protein loading control. b Immunoblot densitometry analysis; values of three independent experiments are expressed relative to control (parental). c Dot plot for PrPC expression of U87 parental and HOPKD populations. PrPC+ cells shown in red and PrPC– cells shown in black. d. Colorimetric BrdU incorporation assay in U87 parental, HOPKD, PrP2, or PrP2/HOPKD populations. Values of four independent experiments are expressed relative to control (parental). *p < 0.05, ANOVA followed by Tukey post-hoc test. e U87 neurospheres cells from parental, PrP2, HOPKD, or PrP2/HOPKD populations (1 × 10⁶ cells) were implanted into the flank of nude mice and the tumor growth was monitored daily. Data represent tumor volume on day 10 after tumor detection (n = 4, *p < 0.05, ANOVA followed by Tukey post-hoc test). f Tumors were resected, fixed, paraffin embedded, and immunostained for Ki67. Representative images of Ki67 labeling (red) and DAPI (nuclei, blue). g Values represent the percentage of Ki67-positive cells relative to total number of cells (nuclei, DAPI staining)
