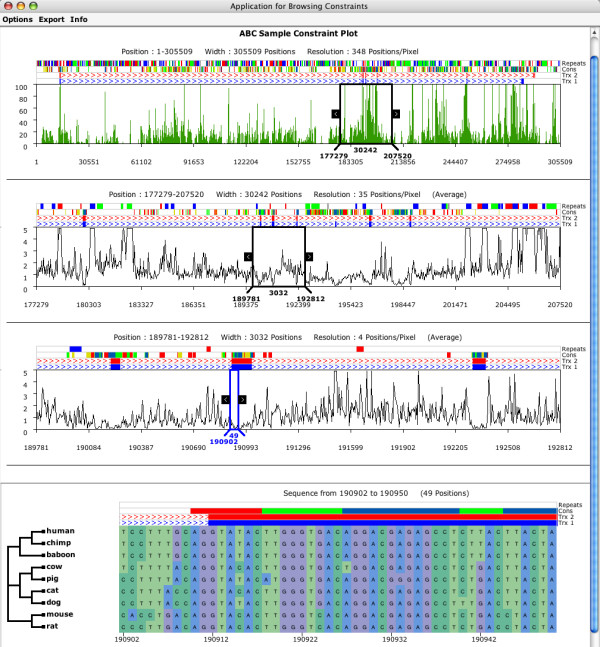
Figure 1.

A screenshot of the ABC. The upper-most panel consists of a histogram describing the regional density of columns with low scores, corresponding to regions of high sequence similarity, across the length of the entire alignment. Note the association of peaks in sequence similarity near the exons annotated in the lowest tracks ('Trx 1' and 'Trx 2'). The middle panels consist of 'wiggly plots' of the alignment scores; note the association in these panels between valleys in the plot and the location of exons. The black rectangle can be moved and resized to highlight particular regions. The panels represent increasingly zoomed in views of the regions highlighted within the rectangle, moving from 348 alignment columns per pixel at the top to 4 positions per pixel in the third panel. The bottom panel shows a view of individual alignment columns corresponding to a small region of the alignment. If supplied, a topology describing the relationships of the aligned sequences is also displayed here. Above all panels, four annotation tracks are displayed, the bottom two being reserved for transcripts with exons and introns. In this image, the third and fourth tracks reveal conserved regions and repeats, respectively.
