Fig. 5.

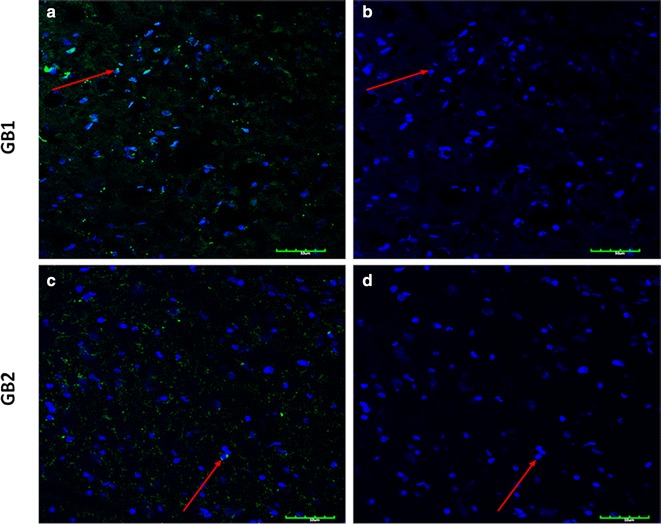
Immunofluorescence: Immunofluorescence of GB1 and GB2 specific markers in insula of the control group. Scale bars 25 mm (GB1) and 50 mm (GB2). a GB1 expression FITC (green), b DAPI, c GB2 expression FITC (green), d DAPI

Immunofluorescence: Immunofluorescence of GB1 and GB2 specific markers in insula of the control group. Scale bars 25 mm (GB1) and 50 mm (GB2). a GB1 expression FITC (green), b DAPI, c GB2 expression FITC (green), d DAPI