
Fig. 3.
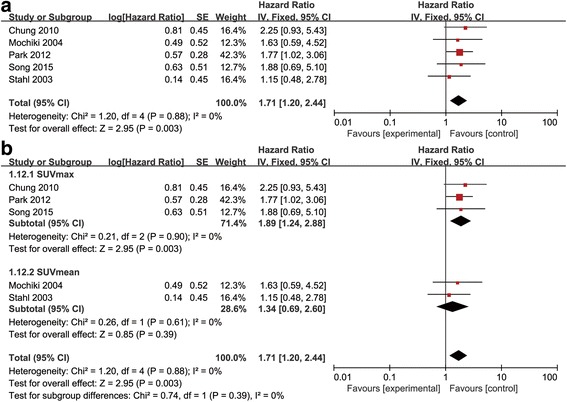
a The results of sensitivity analysis after excluding the study using SUV ratio. b The results of subgroup analysis based on SUVmax and SUVmean
Official websites use .gov
A
.gov website belongs to an official
government organization in the United States.
Secure .gov websites use HTTPS
A lock (
) or https:// means you've safely
connected to the .gov website. Share sensitive
information only on official, secure websites.
a The results of sensitivity analysis after excluding the study using SUV ratio. b The results of subgroup analysis based on SUVmax and SUVmean