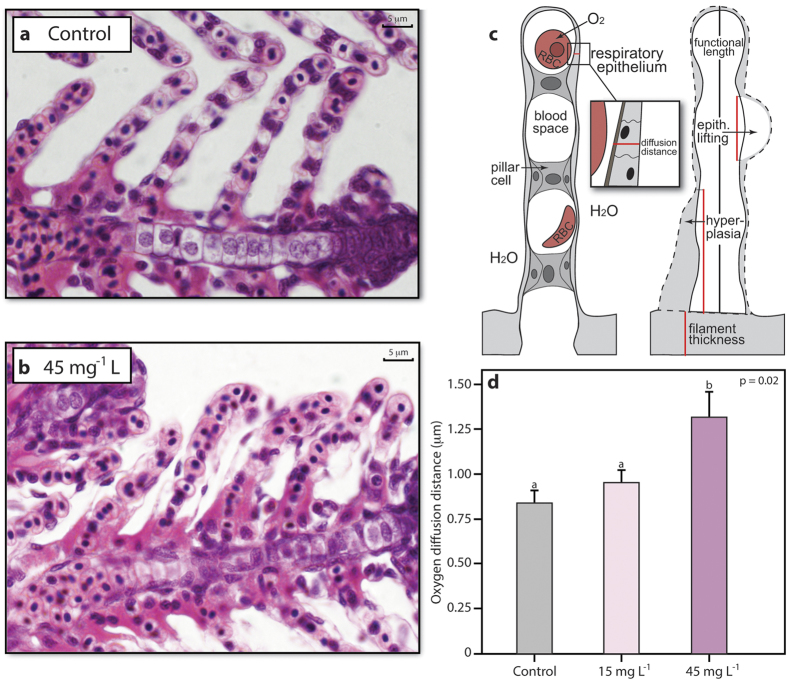
Figure 1. Gill morphology of fishes exposed to control conditions or suspended sediments.
Representative micrographs of lamellae from a control fish (a) and a fish exposed to 45 mg L−1 suspended sediment concentrations with increased levels of hyperplasia (i.e. increased oxygen diffusion distances) at the respiratory epithelium (H&E stain) (c). Schematic of two lamellae depicting oxygen diffusion distance between water and blood (left) and gill changes (right). Red lines indicate distances measured. RBC: red blood cell, epith. lifting: epithelial lifting (b). Mean (±s.e.m.) oxygen diffusion distances at the respiratory epithelium between treatments (d). Different lower case letters indicate significant differences between groups, using P < 0.05.

