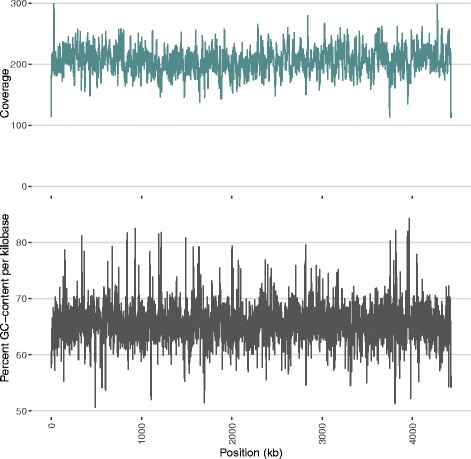
Fig. 1.

Sequencing Coverage and GC-content by Genome Position. GC-content and coverage are shown in 1kb windows. The coverage plot refers to reads mapped to our assembly during the final polishing round. Reads with mapping quality values less than 10 were not used in polishing and are not counted here. Imposing linearity in the contig despite circularity of the genome creates mapping difficulties at the contig edges, resulting in irregularities in apparent sequencing coverage at these sites
