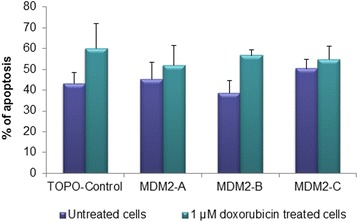
Fig. 5.

Induction of apoptosis. Graphs show the percentage of apoptotic cells after transfection with pCMV (TOPO-Control) and the splice variants. Untreated cells (purple bars) and cells treated with 1 μM doxorubicin (green bars) were analyzed by AnnexinV assay 48 h post transfection. Each pillar represents the total of apoptotic and early apoptotic cells. The experiment was repeated in triplicate with three independent transfections
