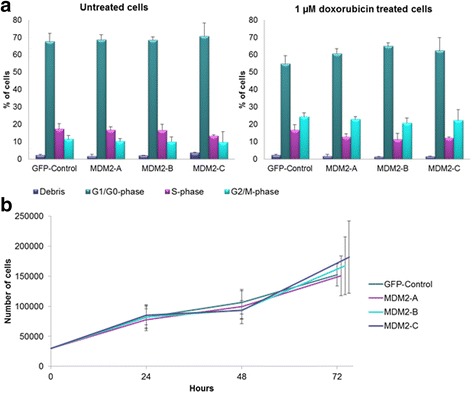
Fig. 6.

Cell cycle analysis. (a) MCF-7 breast cancer cells were transfected with pCMV-GFP (GFP-control), MDM2-A, -B and -C. DMSO control cells (left graph) or cells treated with 1 μM doxorubicin (right graph) for 24 h. The cells were analyzed by NucleoCounter-3000 for status of cell cycle progression. Bars represent cell debris (purple bars), cells in G1/G0-phase (green bars), cells in S-phase (pink bars) and cells in G2/M-phase (blue bars) respectively. (b) Cell proliferation analyzed by cell count. MCF-7 breast cancer cells transfected with pCMV-GFP (GFP-control), MDM2-A, -B and -C were counted to examine the cell proliferation 24, 48 and 72 h after transfection (data points at 72 h have been slightly shifted on the x-axis of the graph, for clarity). Both the experiments were repeated in triplicate, with three independent transfections
