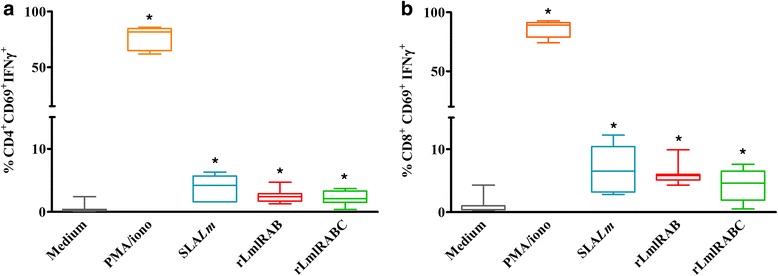
Fig. 4.

Phenotype of IFN-γ producing cells. PBMC were stimulated with PMA (50 ng/ml)/ionomicyn (10–6 M) for 6 h (positive controls), SLA (10 μg/ml), rLmlRAB or rLmlRABC (10 μg/ml) for 120 h. For intracellular IFN-γ detection, cells were treated with Golgistop for the last 6 h of culture, fixed and permeabilized using BD Cytoperm/cytofix kit. Data were analyzed by BD FACS Canto II. Results represent the frequency of IFN-γ producing cells among the CD3 + CD4+ (a) and CD3 + CD8+ (b) cell populations. Wilcoxon signed-rank test was used to compare percentage of cells producing INF-γ (horizontal bars inside the box indicate median values). *Statistically significant differences from stimulated and non-stimulated cultures (P < 0.05)
