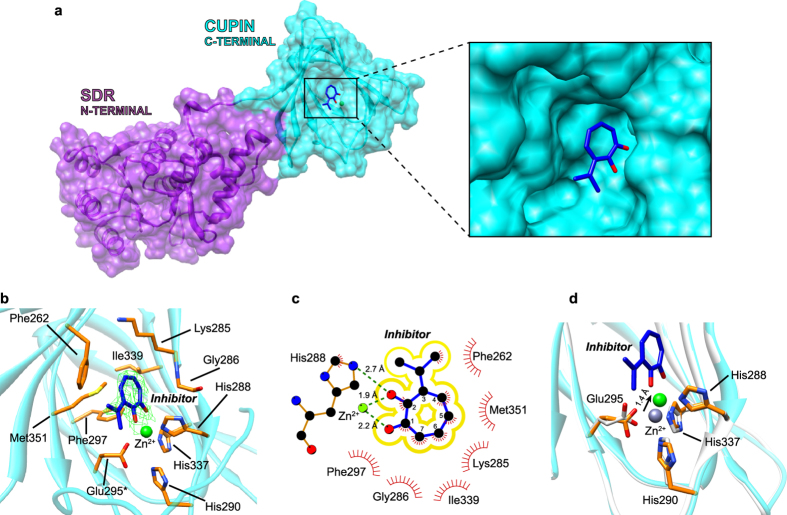
Figure 4. Crystal structure of CapFΔ57-70 in complex with 3-isopropenyl-tropolone.
(a) Overall structure of one protein chain. The compound (blue sticks) binds in the active site of the cupin domain (cyan). The close-up panel illustrates the position of the compound inside the active site. (b) Detailed view of the binding site. The Zn2+ ion is shown as a green sphere. Residues either coordinating Zn2+ or interacting with 3-isopropenyl-tropolone are depicted in orange. The sigma-A weighted 2Fo – Fc electron density map is shown as a green mesh (σ = 2). The sigma-A weighted Fo – Fc electron density omit map has very similar features (not shown). (c) Chemical environment around 3-isopropenyl-tropolone. The panel was prepared with LIGPLOT36. (d) Overlay of unliganded CapF (PDB 3ST7, light gray) and CapFΔ57-70 in complex with 3-isopropenyl-tropolone. The arrow illustrates a shift of the position of Zn2+ ion upon binding of the compound (~1.4 Å). The coordination bond between His290 and Zn2+ is lost in the presence of inhibitor.

