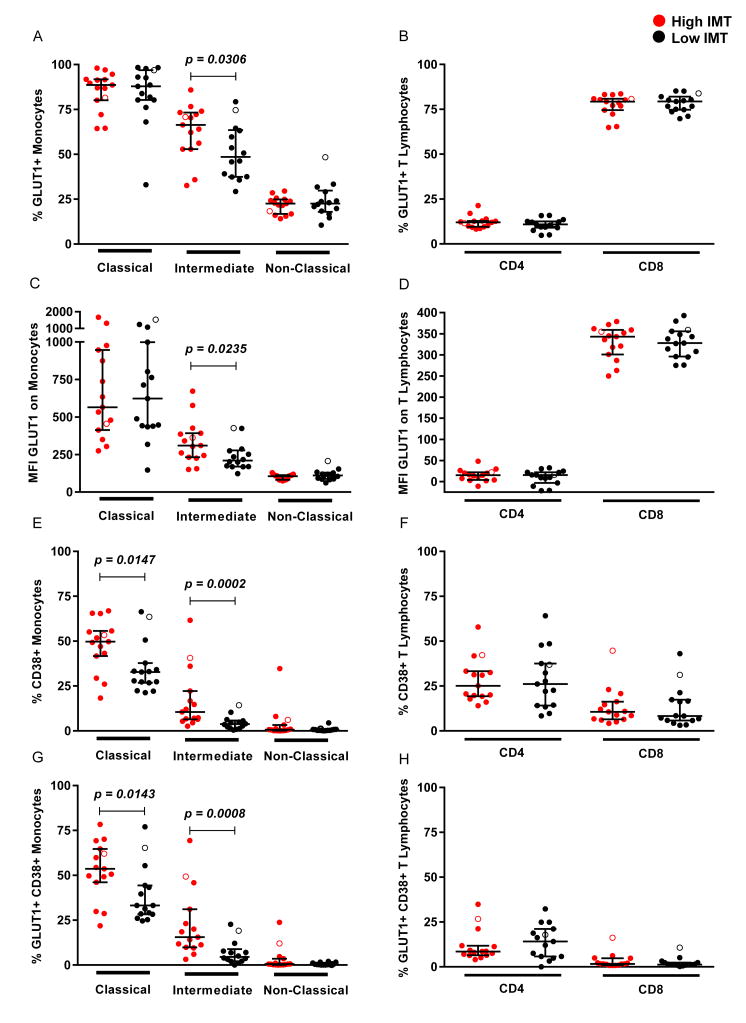
Figure 1. Monocyte and T lymphocyte expression of GLUT1 and CD38 from women with high IMT and low IMT.
Monocyte and T lymphocyte populations were identified by flow cytometry as described in the Methods. The percentage of (A) monocyte and (B) T lymphocyte populations expressing GLUT1. The MFI of GLUT1 on the cell surface of (C) monocytes and (D) T lymphocytes. The percentage of (E) monocyte and (F) T lymphocyte populations expressing CD38. The percentage of (G) monocyte and (H) T lymphocyte populations expressing GLUT1 and CD38. Open circles represent women not on antiretroviral therapy at the time of sample collection.

