Figure 2.
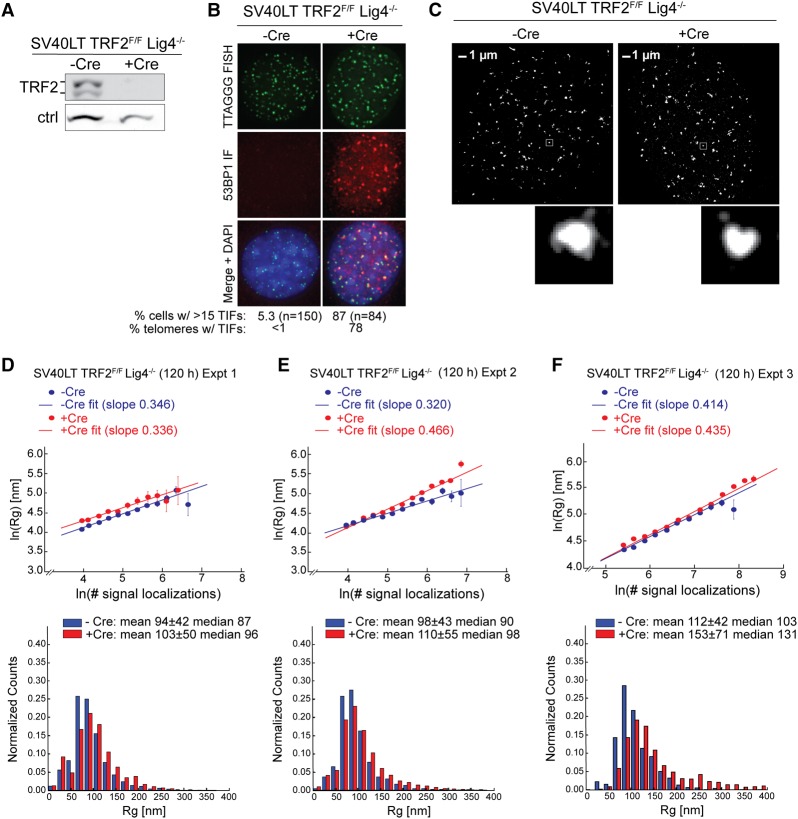
The effect of TRF2 deletion on telomere volume. (A) Representative immunoblot showing deletion of TRF2 120 h after tamoxifen treatment of SV40LT immortalized TRF2F/F Lig4−/− Rosa-CreERT2 MEFs to induce Cre. (Ctrl) Nonspecific band used as loading control. (B) Projected z-stack IF images showing the induction of TIFs in the Cre-treated cells shown in A. (Green) Telomeric FISH with TelG-A647; (red) IF for 53BP1; (merge) green and red channels merged with DAPI DNA stain (blue). The percentage of cells with >15 TIFs is shown as well as the percentage of telomeres containing TIFs. n = 20 nuclei. (C) Representative STORM images showing telomeric foci in cells with and without TRF2 as in A. Enlarged images of selected foci are shown below. (D–F, top) Graphs showing the natural log of Rg plotted versus the natural log of the number of telomere signal localizations in the indicated cells with and without Cre obtained as in C and processed in parallel. n ≥ 10 cells for each condition in each independent experiment. (Bottom) Accompanying histograms of the distribution of Rg values with the means ± SDs and median values given. Cells were treated with Cre for 120 h. D–F represent three independent experiments.

