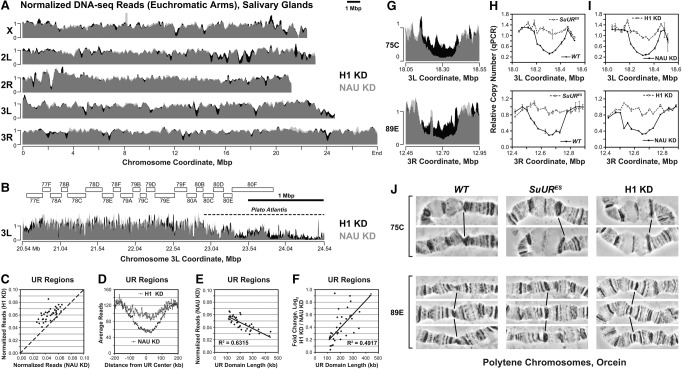
Figure 1.
H1 is required for UR in salivary gland polytene chromosomes. (A) Genome-wide analyses of DNA copy number in Drosophila salivary gland cells. DNA from L3 salivary glands was subjected to high-throughput sequencing. DNA copy numbers (normalized to chromosome arm average) are shown across the entire mapped Drosophila genome. (X, 2L, 2R, 3L, and 3R) Chromosome arms. Genomic coordinates (in megabase pairs) are indicated at the bottom. H1 knockdown trace (H1 KD) is shown in black in the background, and the control trace (NAU KD) is shown in semitransparent light gray in the foreground; their overlap appears as dark gray. (B) Close-up view of a representative genomic region (proximal 3L). (Open rectangles) Polytene cytological bands; (dotted line) the region corresponding to “Plato Atlantis” (Belyaeva et al. 1998; Andreyeva et al. 2007). (C) Suppression of UR in H1-depleted salivary gland cells. For each identified underreplicated region, reads (normalized by the underreplicated region length and total read count) under H1 knockdown (Y-axis) are plotted against reads under control knockdown (X-axis). The dotted line represents equal DNA copy numbers for both conditions. (D) The average extent of UR and its suppression by H1 knockdown across underreplicated regions. Average read counts (normalized to total read count) were calculated across all identified underreplicated regions for control and H1 knockdowns as indicated (Y-axis). The distance from the underreplicated region center (in kilobases) is indicated on the X-axis. (E) Dependence of the extent of UR on the underreplicated region length. For each underreplicated region, normalized read counts in the control knockdown (Y-axis) are plotted against the length of the region (X-axis). (F) Dependence of the extent of H1 knockdown-dependent suppression of UR on the underreplicated region length. The log2 fold change of read counts in H1 knockdown relative to control (Y-axis) is plotted against the length of each underreplicated region (X-axis). (G) Close-up views of DNA copy number (from high-throughput sequencing, normalized to chromosome arm average) are shown for H1 (black in the background) and control (semitransparent light gray in the foreground) knockdowns. (75C and 89E) Corresponding cytological regions. Genomic coordinates (in megabase pairs) are indicated at the bottom. (H) Change of DNA copy number in homozygous SuURES mutant salivary glands versus the wild type (Oregon R; WT) was determined by quantitative PCR (qPCR). Copy numbers were calculated relative to embryonic DNA and normalized to a control intergenic region. The X-axis shows chromosome positions (in megabase pairs) of target amplicons. (I) Same as in H, except DNA copy numbers were compared between H1 knockdown (H1 KD) and the control (NAU KD). (J) Representative cytological images (orcein staining and phase contrast) of polytene chromosome fragments flanking cytological regions 75C and 89E in wild-type (Oregon R; WT), homozygous SuURES, and H1 knockdown (H1 KD) salivary glands. Slanted lines indicate 75C or 89E bands.

