
Figure 3.
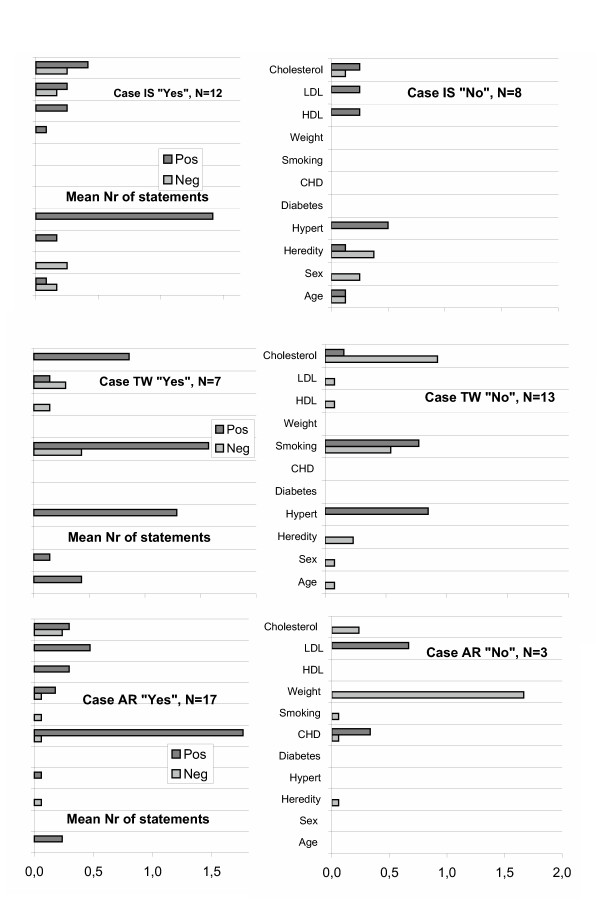
Patterns of importance for "Yes" and "No" decisions. As in Figure 2, the mean numbers of statements with a positive and negative directionality are shown for the 11 different information categories. In Figure 3, the patterns of positive and negative evaluations across the information categories are shown separately for the subgroups with "Yes" decisions and "No" decisions, respectively. Three of the six patient cases are shown.