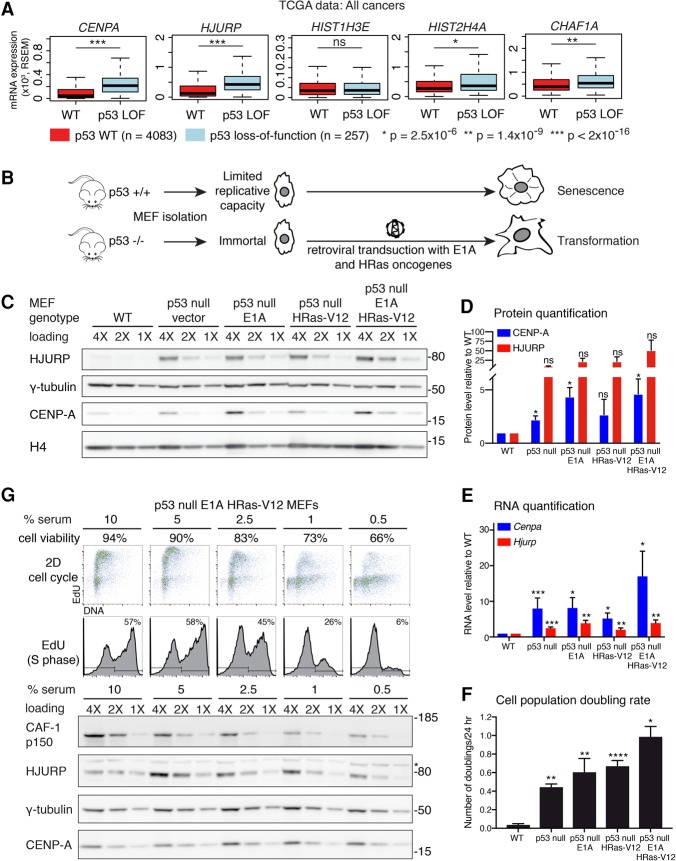
Figure 1.
CENP-A and HJURP levels are increased in human tumors and MEFs with inactivated p53. (A) Box plot comparisons of relative expression (mRNA) of genes coding for CENP-A (CENPA), HJURP (HJURP), CAF-1 p150 (CHAF1A), H3.1 (HIST1H3E), and H4 (HIST2H4A) from all cancers (28 cancer types), classified according to p53 status (TCGA provisional data). Tumors are either wild type for TP53 (diploid with no detectable mutations; n = 4083) or p53 loss of function (LOF) (homozygous deletion or heterozygous deletion + TP53 mutation featuring nonsense or in-frame truncations, resulting in p53 inactivation; n = 257). All other TP53 mutants were excluded. mRNA levels are expressed in RSEM (RNA-seq by expectation maximization) units. We used Wilcoxon rank sum tests to compute significance. (B) Experimental scheme outlining the MEF cellular system used in this study. MEFs extracted from wild-type mice have a limited replicative capacity in cell culture. Mice lacking p53 (p53-null) are immortal and can be transformed by a single oncogene, which we introduced into cells by retroviral transduction of E1A and HRas-V12, expressed under the control of the viral promoter. (C) Western blot of HJURP and CENP-A levels in RIPA-soluble extracts from wild-type MEFs or p53-null MEFs transduced with empty vector, E1A, or HRas-V12 or sequentially with E1A and HRas-V12. γ-Tubulin was used as a loading control. H4 levels are also shown. A twofold dilution series of each extract is represented by 4X, 2X, and 1X. Molecular weight protein markers are indicated at the right. (D) Quantification of HJURP and CENP-A protein levels from the MEFs described in C. Results are represented as fold change compared with wild-type cells. Error bars represent the SEM of three experiments. (E) RT-qPCR analysis of Cenpa and Hjurp mRNA levels in the MEFs described in C. Results are represented as fold change compared with wild-type cells. Error bars represent the SEM of at least three experiments. (F) Proliferation rate is represented as the average of cell doublings per 24 h for the MEFs described in C. MEFs (3 × 10⁴) were seeded in 1 mL of growth medium on 24-well plates. Error bars represent the SEM from triplicate experiments. (D–F) (****) P < 0.0001; (***) P ≤ 0.0005; (**) P ≤ 0.005; (*) P ≤ 0.05; (NS) not significant, significance determined by a t-test. (G) Cell cycle and Western blot analysis of p53-null, E1A, and HRas transformed MEFs grown in medium containing decreasing concentrations of serum (10%–0.5%, as indicated) for 96 h to decrease their proliferative rate. We determined cell viability by trypan blue exclusion (percentage of viable cells indicated). (Top panels) Cell cycle analysis by flow cytometry, performed following EdU and propidium iodide (PI) staining. The percentage of EdU-positive cells (S phase) is indicated. Western blot of HJURP and CENP-A levels in RIPA-soluble extracts. The CAF-1 p150 subunit was used as a proliferation marker (Polo et al. 2010), and γ-tubulin was used as a loading control. A twofold dilution series of each extract is represented by 4X, 2X, and 1X. Molecular weight protein markers are indicated at the right.

