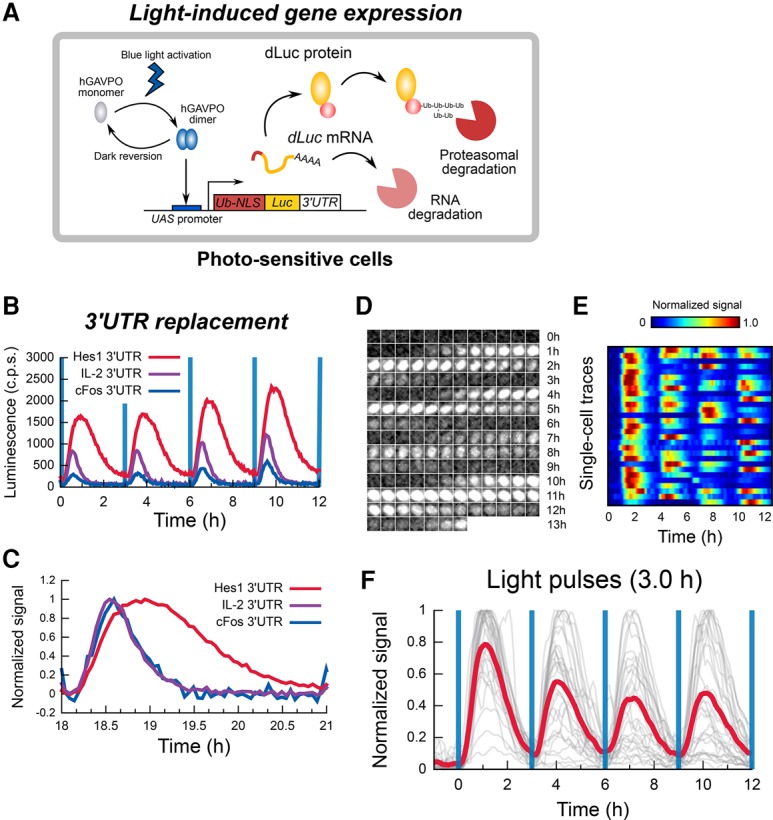
Figure 1.

Optogenetic perturbation system. (A) Schematic of the light-inducible gene expression system based on hGAVPO. Blue-light illumination activates hGAVPO, which induces downstream gene expression under the control of the UAS promoter. Here, the effects of 3′ untranslated region (UTR) sequences on the optogenetic input were examined by using the ubiquitinated nuclear localization signal (Ub-NLS)-luciferase (Luc) construct. (B) The effects of 3′ UTR sequences on light-induced gene expression patterns. (c.p.s.) Counts per second. (C) The effects of 3′ UTR sequences on light-induced gene expression patterns in B were normalized. (D–F) Single-cell bioluminescence imaging of oscillatory gene expression patterns induced by the construct containing the Hes1 3′ UTR with a 3-h period of blue-light illumination. (D) Snapshots for a single cell imaged for 13.5 h. (E) A heat map of single-cell traces. Each line represents a cell. (F) Population (red) and single-cell (gray) time series.
