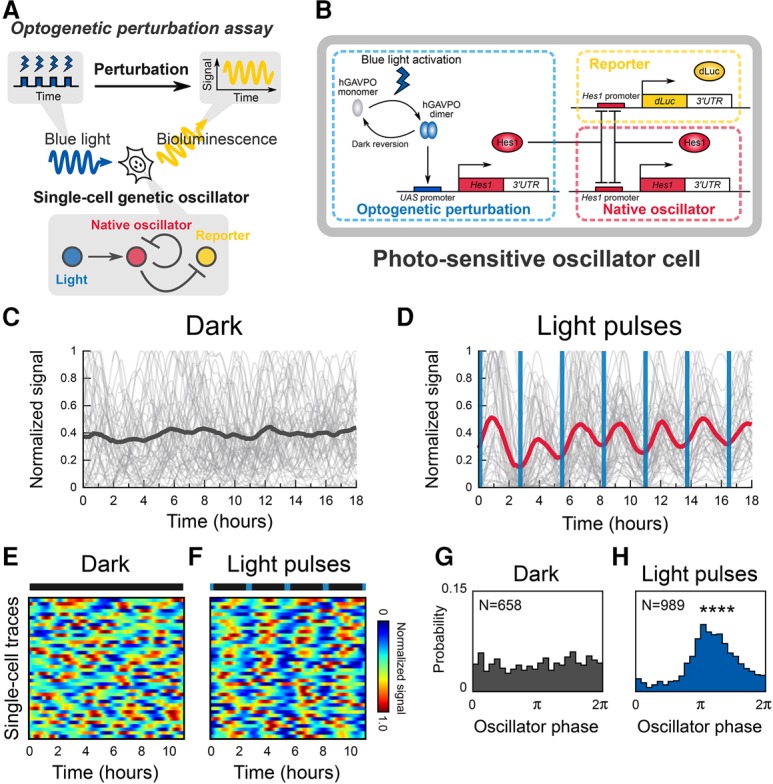
Figure 2.

An integrated approach for visualizing and controlling a natural genetic oscillator. (A) Schematic of the single-cell optogenetic perturbation experiments in a cell-autonomous system. (B) Schematic of the genetic network comprising a bioluminescent reporter (dLuc) and an optogenetic perturbation module using hGAVPO, which are connected to a native oscillator module of the Hes1 negative feedback loop. (C) Single-cell time series (gray lines) and a trace of the population average of luminescent signals (black line) in a dark condition. (D) Single-cell time series (gray lines) and a trace of the population average of luminescent signals (red line) in the presence of 2.75-h period blue-light pulses. Blue vertical lines represent the timing of illumination with 2-min duration. (E,F) Heat maps represent single-cell traces in the dark (E) and with light pulses (F). (F) Blue markers in a bar indicate the timing of light illumination. (G,H) Phase distribution of individual cells in a dark condition (G) or in the presence of 2.75-h period blue-light pulses (H). P = 0.015 for a dark condition; (****) P < 0.0001 (Rayleigh test).
