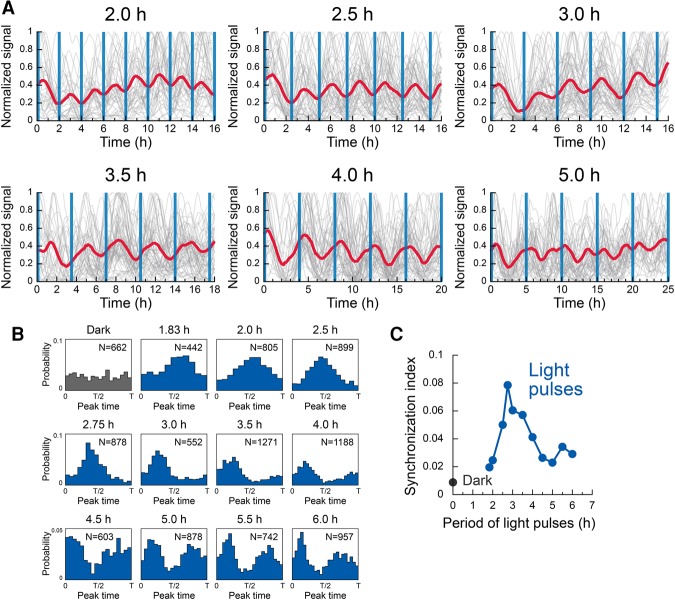
Figure 3.
Entrainment of a population of genetic oscillators by periodic optogenetic perturbation. (A) Single-cell traces (gray) and traces of population average (red) in the presence of periodic perturbation at periodicities ranging from 2.0 to 5.0 h. Blue vertical lines represent timings of illumination of a 2-min duration. (B) Peak time distributions under the dark condition or perturbation at periodicities ranging from 1.83 to 6.0 h. N represents the number of analyzed peak events. (C) Synchronization index calculated by the entropy-based method.

