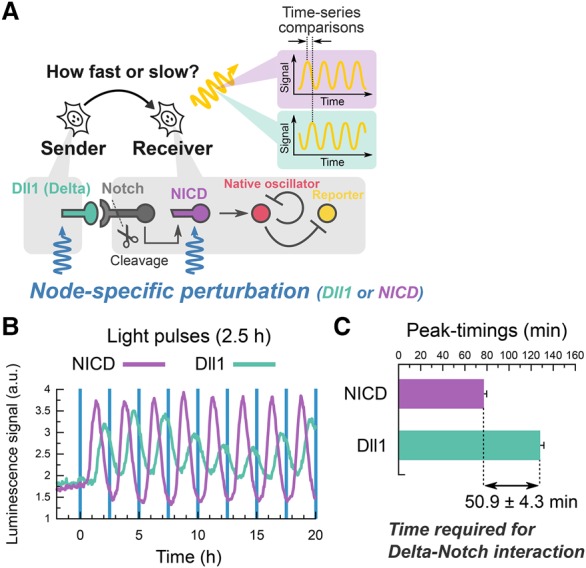
Figure 6.

Node-specific optogenetic perturbation reveals the time required for ligand–receptor interactions. (A) Schematic of the node-specific perturbation in the Delta–Notch pathway. Membrane-bound Dll1 triggers the cleavage of Notch receptors and gives rise to the production of the NICD, which is an active form of Notch receptor. Node-specific perturbation directly controls either Dll1 or NICD production. (B) Population signaling traces of Hes1 promoter activity in the presence of Dll1-specific (green) or NICD-specific (purple) perturbation with a 2.5-h period. The data were acquired by a photomultiplier tube. Blue vertical lines represent the timings of illumination of a 2-min duration. (C) Comparison of peak timings between Dll1-specific (128.1 min ± 3.4 min) and NICD-specific (77.2 min ± 2.6 min) perturbations identified the time required for Delta–Notch signaling transmission (50.9 min ± 4.3 min). n = 12 pairs of comparative peaks.
