Figure 1.
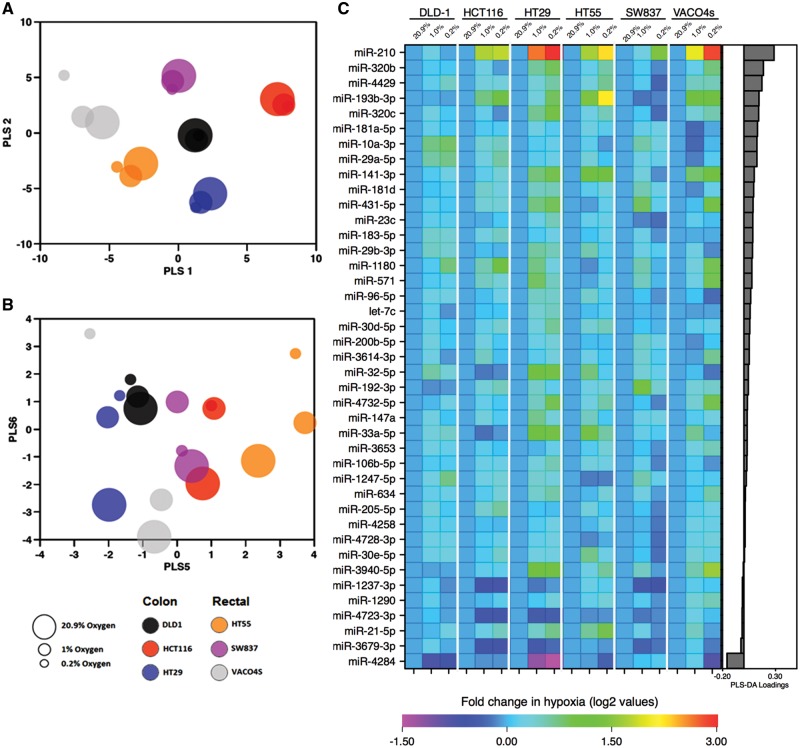
Altered miRNA expression profile under hypoxic conditions. Log-transformed fold change expression of significant miRNAs between normoxia (20.9%) and both low oxygen conditions (1 and 0.2%) in six CRC cell lines for 48 h. (A) Data were subjected to PLS-DA, which was supervised according to cell line and unsupervised to oxygen tension. Observation of the first two axes (PLS 1 and PLS 2) demonstrated a clear separation of the miRNA data between the different cell lines, suggesting the main variation in the data is because of the differential expression of the miRNAs between the cell lines; further cell line differences were observed on additional PLS axes and are not shown here (six axes were fitted on the basis of cross-validation). (B) A separation of the data according to oxygen tension was observed along PLS axis 6 in five of the six cell lines (excluding SW837). This model indicates an existence of differential expression of miRNA between cells maintained under the three different oxygen conditions. (C) miRNAs that are significantly altered under hypoxia were subsequently identified by linear regression multivariate analysis. A heatmap of log-transformed fold changes between the different oxygen tensions normalized to 20.9% is shown. The miRNAs are ranked according to PLS-DA loadings.

