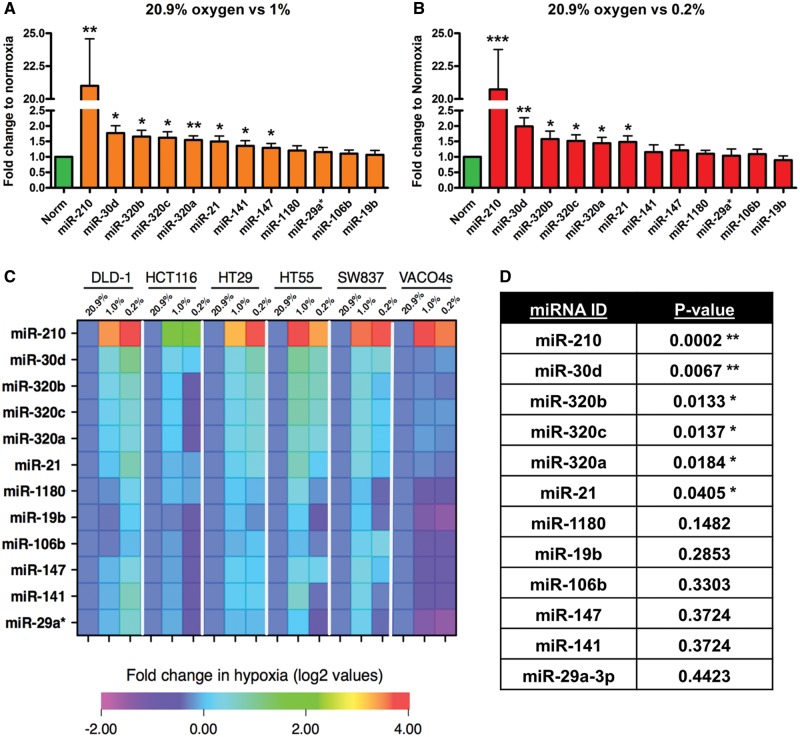
Figure 2.
Validation of hypoxia-responsive miRNAs by qRT-PCR in six CRC cell lines. (A and B) Fold change expression of candidate miRNAs in normoxia (20.9%) and low oxygen tensions (1 and 0.2% oxygen) in six CRC cell lines combined. (C) Heatmap of fold change (log 2) in miRNA expression between the three oxygen conditions normalized to 20.9% oxygen (n = 3). (D) Multivariate analysis (linear regression model) identified a significant up-regulation of 6 of the 12 miRNAs between in hypoxia. The heatmap is ranked according to P-values obtained from the multivariate analysis. Asterisks indicate significantly altered (P < 0.05) miRNAs. Bars represent mean values with SEM calculated from three individual experiments. *P < 0.05, **P < 0.01 and ***P < 0.001.

