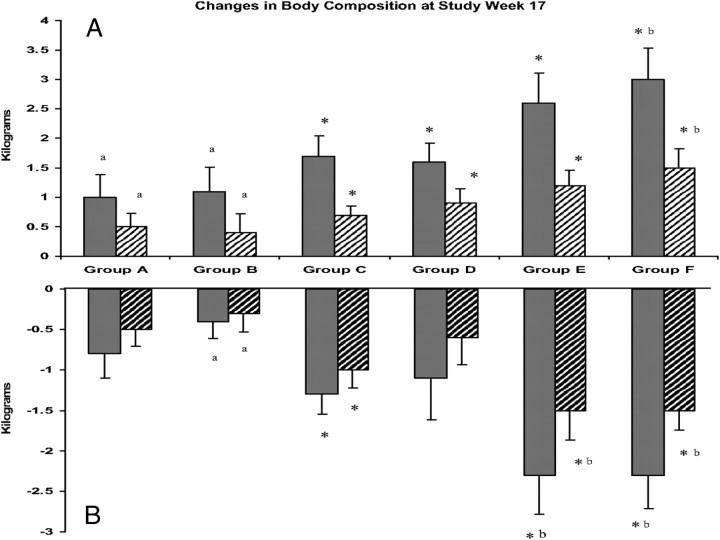
Figure 6.
DEXA-derived changes (mean ± se) in LBM and fat mass for each treatment group (T transdermal gel 5 g, groups A–C; 10 g, groups D–F; rhGH 0 μg/kg · d, groups A and D; 3 μg/kg · d, groups B and E; and 5 μg/kg · d, groups C and F) from baseline to wk 17. A, Increases in total LBM (solid bars) and appendicular lean mass (hatched bars). Changes across groups are significant for linear trend for total lean mass (P = 0.0002) and appendicular lean mass (P = 0.0002). B, Decreases in total BF mass (solid bars) and trunk fat (hatched bars). Changes across groups are significant for linear trend for total fat mass (P = 0.0004) and trunk fat (P = 0.0003). *, Bonferonni adjusted within group changes (P < 0.008). Pairs of treatment groups with different letters (e.g., a vs. b) are significantly different by one-way analysis of covariance with pairwise comparison (Tukey adjusted; P < 0.05). [Reproduced from F. R. Sattler et al.: Testosterone and growth hormone improve body composition and muscle performance in older men. J Clin Endocrinol Metab 94:1991–2001, 2009 (602), with permission. © The Endocrine Society.]

