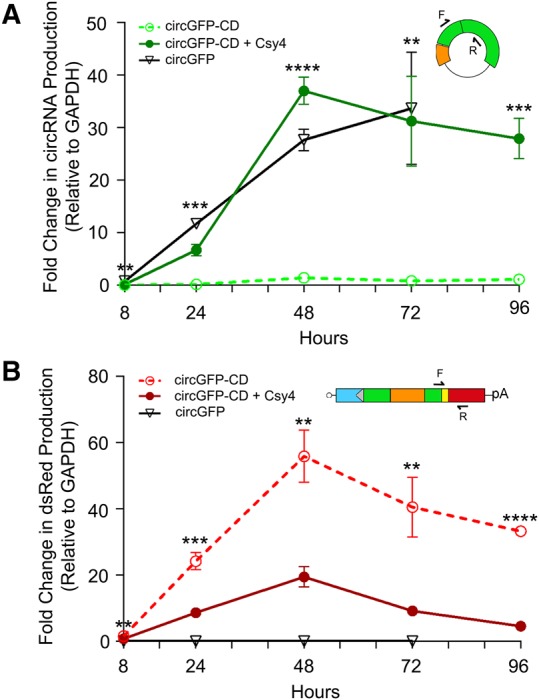
FIGURE 4.

qRT-PCR analysis of the accumulation of circRNA and linear splicing products after transfection. qRT-PCR analysis of cDNA generated from RNA isolated at 8, 24, 48, 72, and 96 h for circRNA (A) or linear RNA (B) was normalized to glyceraldehyde 3-phosphate dehydrogenase (GAPDH). Cells were transfected with circGFP-CD (open circles, dotted line), circGFP-CD and Csy4 (closed circles, solid line), or with a circGFP plasmid (open triangles, solid line). qRT-PCR was carried out using primers specific for either circular (A) or linear (B) splicing products as depicted above each graph. Error bars indicate standard deviation of three biological replicates. Statistical significance was calculated using a two-tailed Student's t-test ([****] P ≤ 0.0001, [***] P ≤ 0.001, [**] P ≤ 0.01, [*] P ≤ 0.05).
