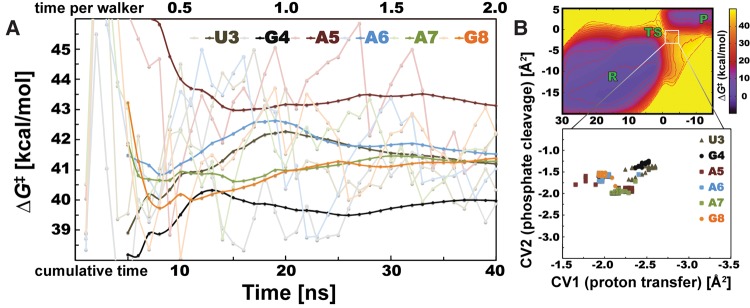
FIGURE 2.
Convergence of cleavage barriers and distribution of TS positions of nucleotides from uGAAAg tetraloop. (A) Instantaneous estimates of ΔG‡ barrier (shaded lines) fluctuate, whereas barriers calculated from time-averaged bias potentials (see Materials and Methods) are converged (bold lines). Each uGAAAg nucleotide is displayed in a specific color with two (shaded and bold) tones. Horizontal axis has two scales, showing timescale of single simulation (one walker, upper scale) or cumulative time considering 20 concurrent QM/MM-MetaD simulations (lower scale). The ΔG‡ values were analyzed every 1 nsec in total timescale. (B) Position of TS states on FES is not changing significantly during QM/MM-MetaD simulations. TS states of all tested nucleotides from uGAAAg tetraloop are located within the same area with minimal changes of CV2 (describing the proton transfer). Colors for each nucleotide and the interval for analysis correspond with those on panel A.

