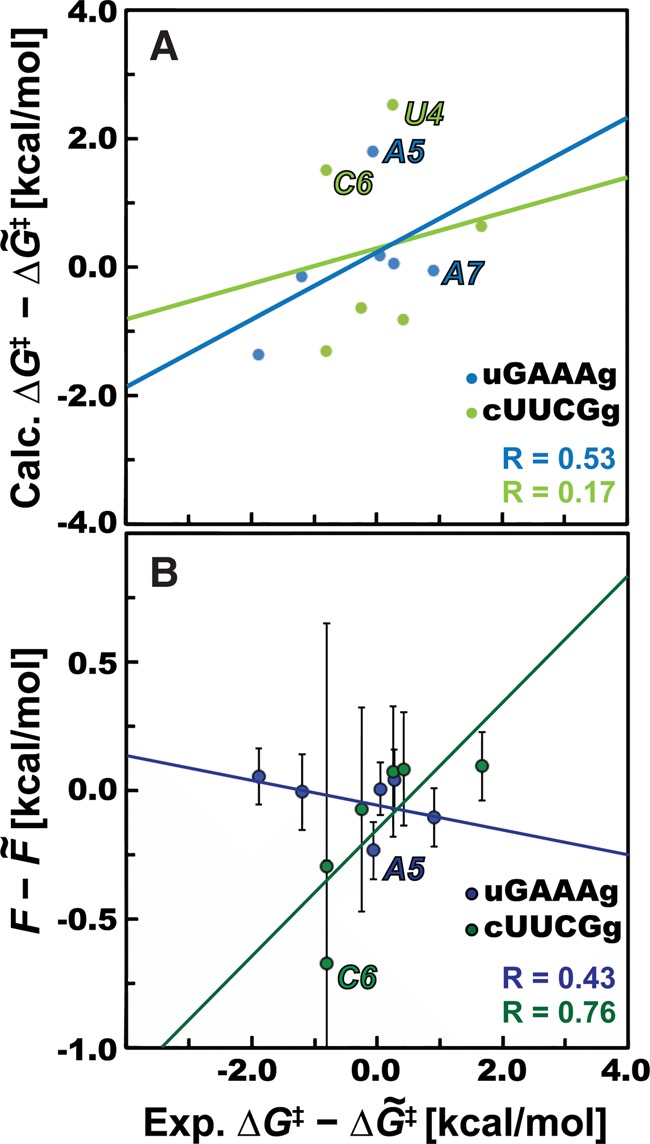
FIGURE 4.

Direct correlation between theory and experiments for nucleotides within two tetraloops. (A) The correlation between calculated ΔG‡ and barriers derived from experiments for nucleotides within uGAAAg (blue) and cUUCGg (green) tetraloops. Both computed and experimental barriers are displayed as deviations from the corresponding median value. (B) A similar correlation plot obtained using the logarithm of in-line fitness F = −RTln(Fitness) (Soukup and Breaker 1999), instead of the here calculated ΔG‡. We displayed averaged values of fitness from the set of X-ray structures (considering 41 uGAAAg and 754 cUUCGg tetraloops, respectively) from the PDB database with bars showing their standard deviations. F-values are displayed the same way as ΔG‡ barriers subtracting medians. Points corresponding to specific residues that are worsening the correlation (outliers) are labeled.
