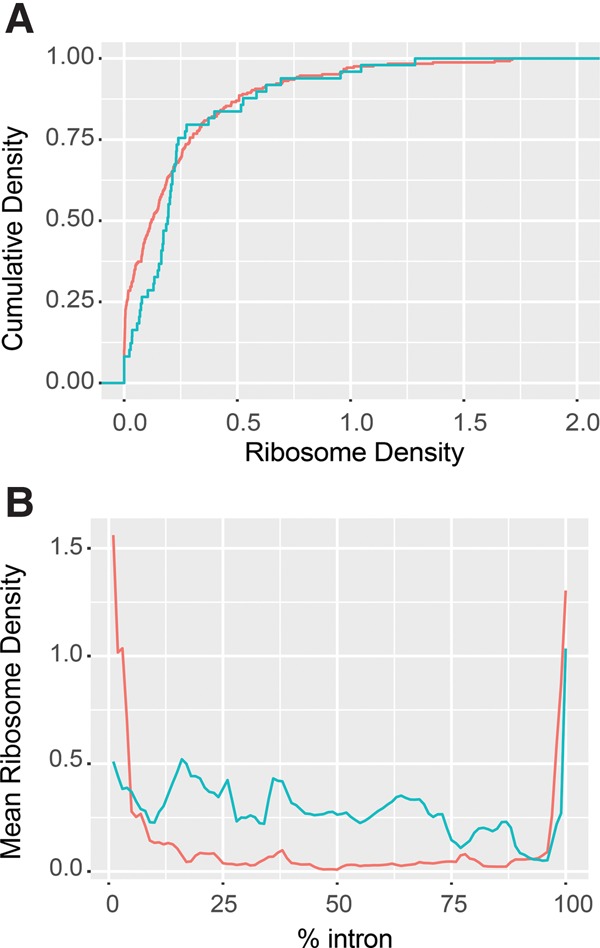
FIGURE 4.

NMD targeted intron-containing pre-mRNAs are engaged in translation. (A) Cumulative density plot of ribosome density of the intronic regions for pre-mRNAs targeted (blue, n = 57) or not targeted (red, n = 244) by NMD. This plot illustrates the fraction (on the y-axis) of transcripts having the indicated ribosome densities (on the x-axis). (B) Distribution of mean ribosome densities over normalized intronic regions for the same two sets of intron-containing transcripts as in A. Plots in A and B were derived from the ribosome profiling data of WT cells by Young et al. (2015). Ribosome densities were calculated as profilingcoverage/RNA-seqcoverage for each intron. Introns of NMD-targeted pre-mRNAs show higher ribosome densities than introns of the pre-mRNAs that are not targeted by NMD (two-sample KS test P = 0.038).
