
FIGURE 5.
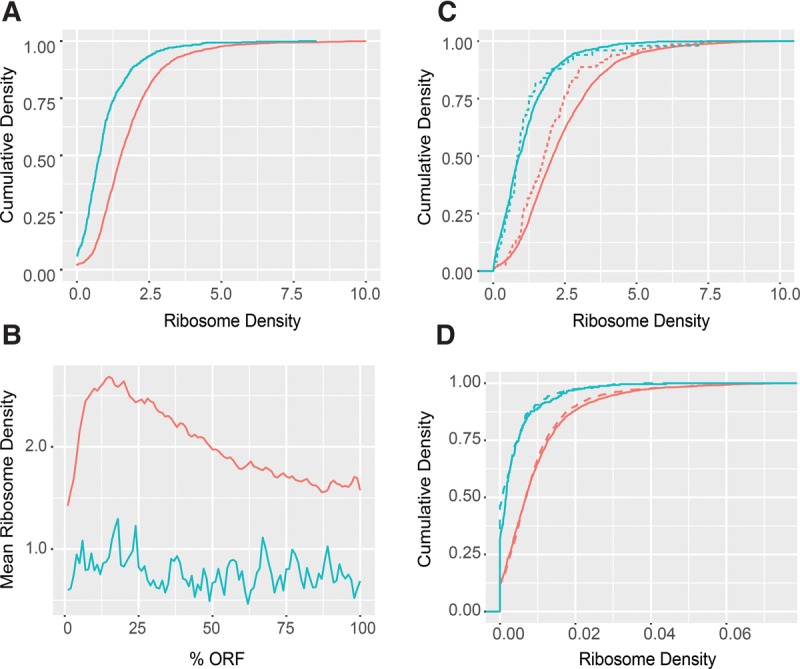
NMD substrates are less efficiently translated than nonsubstrates independent of the NMD machinery. (A) Cumulative density plots of ribosome densities derived from ribosome profiling data of WT cells for normal-looking NMD substrates (blue n = 746) and non-NMD substrates (red = 4633). (B) Mean ribosome densities over normalized ORFs derived from the same data and for the same two sets of transcripts shown in A. (C) Cumulative density plots of ribosome densities derived from the same data in A for uORF-containing transcripts targeted (dashed, blue n = 42) or not targeted (dashed, red n = 199) by NMD and for uORF-lacking transcripts targeted (solid, blue n = 704) or not targeted (solid, red n = 4434) by NMD. (D) Cumulative density plots of ribosome densities derived from other ribosome profiling data sets of WT (solid) and upf1Δ (dashed) cells for normal-looking NMD substrates (blue) and non-NMD substrates (red) shown in A. Plots in A, B, and C were derived from the ribosome profiling data of Young et al. (2015), and plots in D were derived from the ribosome profiling data of Smith et al. (2014). Ribosome densities were calculated as profilingcoverage/RNA-seqcoverage for each transcript. Two-sample KS test P-values are described in the Results section.