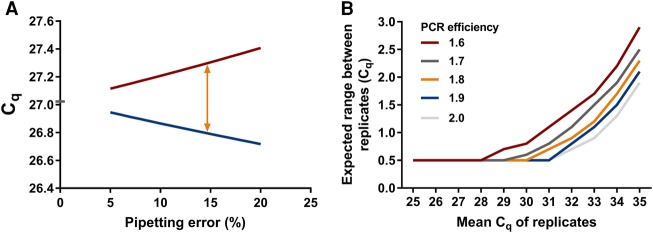
FIGURE 2.
Sources of variation in observed Cq values between replicates. (A) Relation between pipetting error and Cq range between replicate measurements. A pipetting error of 15% leads to a range of 0.5 between replicates. Red line represents the Cq of the pipetting error down and blue line represents the Cq of the pipetting error up. Orange arrow indicates where the 0.5 cycles between replicates is expected, which is at 15% pipetting error. For the calculations behind this figure, see calculation 1 in Materials and Methods. (B) The maximum acceptable Cq difference between replicates increases with increasing mean Cq of the replicates (lower copy number input in the reaction) and is dependent on the PCR efficiency. Note that in the graph, 0.5 cycles is considered to be the maximum allowable Cq range for Cq values where pipetting error is the prevalent cause of variation. For the calculations behind this figure, see calculation 2 in Materials and Methods.

