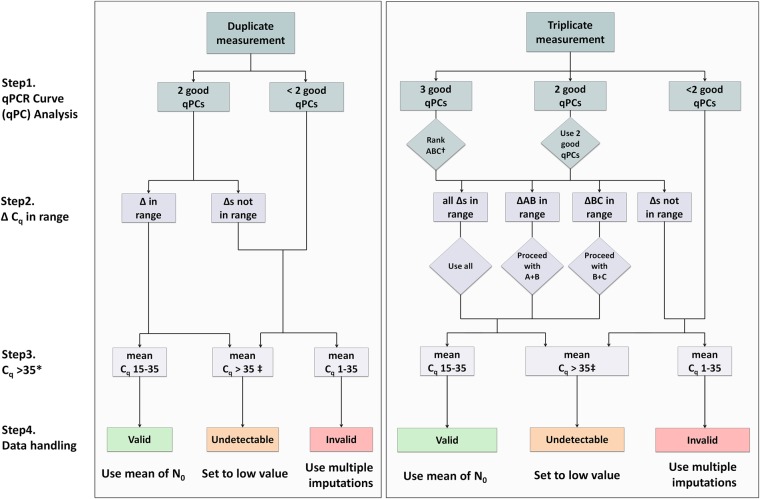
FIGURE 3.
Flow diagram of the data handling pipeline for duplicate and triplicate measurements. An extensive description of the pipeline is given in the Results. Briefly, in step 1, melting and amplification curve analysis is performed by the user. In step 2, the ΔCq of the replicates must be evaluated to check if they are in the allowed range of each other (for the maximal acceptable range between replicates, see Table 1). Then, based on a critical Cq value, in step 3, each measurement is categorized as valid, invalid, or undetectable and is handled accordingly. (*) For most PCR machines and experiments, a critical value of 35 will be optimal; however, this critical Cq may be changed by the user if inappropriate for the experiment. (†) When using triplicates and all reactions are OK, replicates A, B, and C must be ranked based from lowest to highest Cq. This step avoids discarding all replicates when two out of three are in range of each other and can therefore still be used in the analysis. (‡) A Cq of zero (no amplification) must be considered the same as having a Cq > 35. qPC = qPCR curve.

