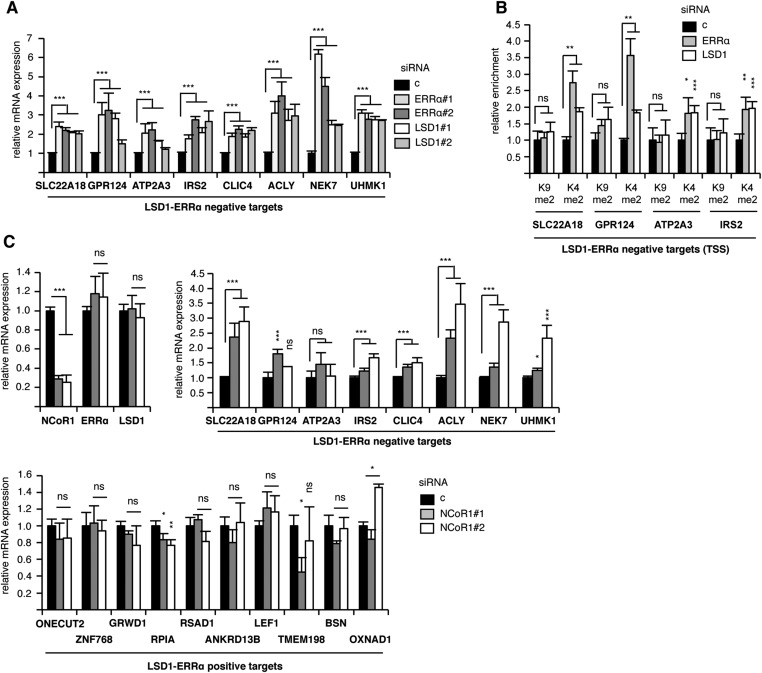
Fig. S6.
Features of LSD1–ERRα-repressed genes. (A) Similar to Fig. 1C, analyzing the expression of the LSD1–ERRα-repressed genes. (B) Similar to Fig. 2, analyzing histone marks at the TSS of the indicated genes. (C) Similar to Fig. 1C, analyzing the effect of siRNA-mediated NCoR1 inactivation on the indicated genes. Values are mean ± SEM (three independent experiments). Significance is shown relative to control conditions. *P < 0.05; **P < 0.01; ***P < 0.005; ns, nonsignificant.

