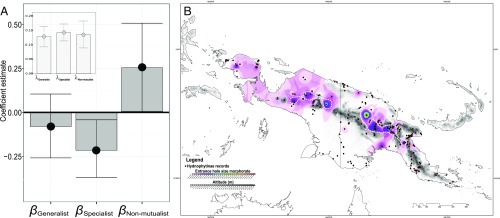
Fig. 3.
Entrance hole evolution correlates with mutualistic strategy. (A) Estimated coefficient values from a Bayesian hierarchical model testing the effect of the evolutionary rate of entrance hole-size change (morphorate) on mutualistic strategy, showing means and 95% CI. The models control for phylogenetic autocorrelation, and a detailed description of regression components is presented in SI Appendix, SI Materials and Methods. Values reflect standardized data and can be interpreted as relative effect sizes. (Inset) Fitted values of phylogenetic signal (Pagel’s λ, mean, and 95% CI). (B) Map showing the inferred morphological rate of entrance hole-size (morphorate) evolution linked to species’ distribution in mainland New Guinea. Black dots with red circles show Hydnophytinae occurrences. Dotted lines show the entrance hole-size morphorate “hotspots,” concentrated in high-altitude areas.

