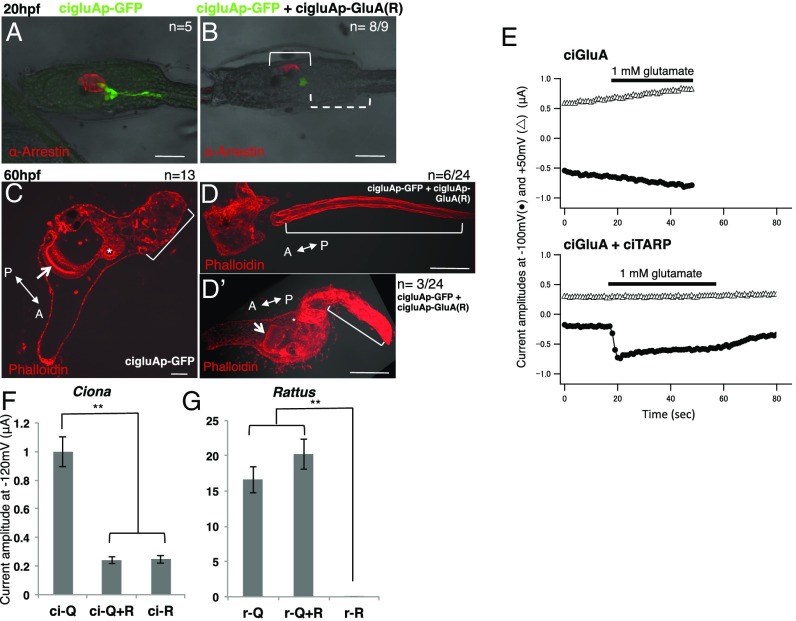
Fig. 4.
Artificial Ciona R-type GluAs dominantly inhibit activity of Q-type GluAs. (A and B) DIC images of hatched larvae merged with GFP and arrestin staining patterns. In B, the dotted bracket indicates GFP-positive cells with defective axons and the solid bracket indicates partial loss of arrestin-positive photoreceptor cells in an R-type ciGluA electroporated larva. (C–D’) DIC images merged with F-actin labeling with phalloidin in juveniles. The arrow and asterisk in C and D’ indicate the endostyle and digestive tract, respectively, showing that the internal organs developed normally. The bracket in D indicates a cut tail. The bracket in D’ indicates a tail that failed to shrink. The bracket in C indicates a normal, shrunken tail. In control samples, all samples (n = 13) showed normal regression. In the R-type ciGluA electroplated samples (n = 22), 32% of samples were normal (n = 7), and 68% (n = 15) showed abnormal tail regression. Among these, seven showed impaired regression, and eight showed no regression. Seven of the eight larvae with no regression had cut tails. [Scale bars, 50 μm (A–C) and 100 μm (D and D’).] (E) Current flow induced by glutamate application in Xenopus oocytes voltage clamped at –100 mV (filled circles) and +50 mV (open triangles). Upper plots currents in oocytes injected with cRNA for ciGluA alone, and Lower plots currents in oocytes injected with both cRNA for ciGluA and ciTARP. Black bars indicate the timing of glutamate application. (F and G) The average peak current amplitude after glutamate application in Xenopus oocytes injected with only Q-type or R-type, or mixed subunit types (Q/R-hetero). All data were obtained in the absence of extracellular Ca2+, and TARP was coexpressed in all groups. r, rat. n = 6–11. Mean ± SE. **P < 0.001.

