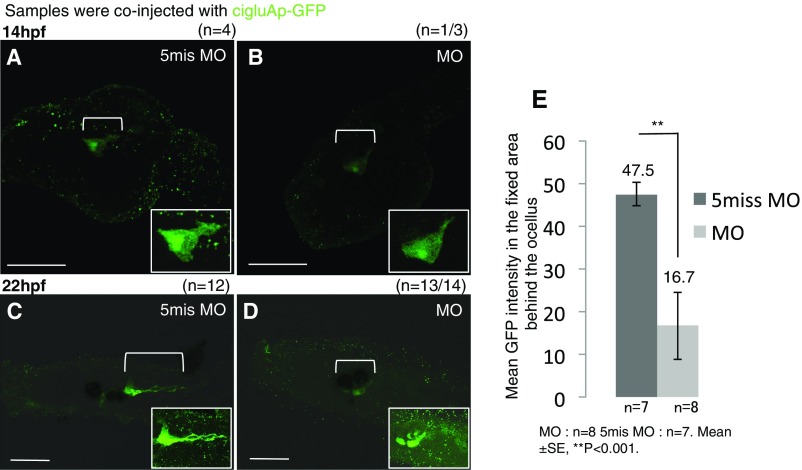
Fig. S3.
GluA knockdown leads to abnormal differentiation of GluA-expressing cells (related to Figs. 2 and 3). (A and C) Samples injected with control 5mis MO. (B and D) MO against ciGluA. (A and B) Late tailbud stage larval images with GFP immunostaining. (C and D) Hatched larval DIC images merged with GFP immunostaining. The white boxes in A–D are higher magnification images of the bracket regions. (Scale bars, 50 μm.) (E) Mean intact GFP intensity in the bracketed region measured by ImageJ at 20 hpf. Mean ± SE, **P < 0.001.

