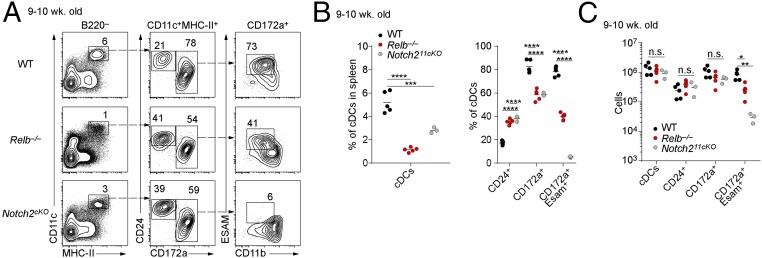
Fig. 3.
cDC2s develop in Relb−/−mice. (A) Flow cytometry analysis of splenic cDCs in 9-wk-old WT, Relb−/−, and Notch211cKO (Notch2f/f × Itgax-Cre) mice. Data are representative of three independent experiments. (B) Percentage and (C) cell counts of splenic cDCs in spleens of WT, Relb−/−, and Notch211cKO. Each dot represents a biological replicate from three independent experiments. n.s., not significant. *P < 0.05, **P < 0.01, ***P < 0.001, ****P < 0.0001.

