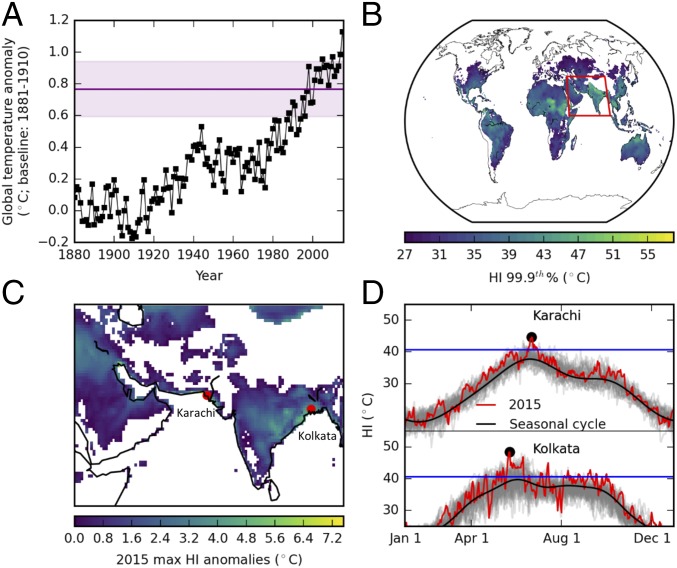
Fig. 1.
Mean air temperatures and recent HI extremes. (A) Global mean air temperature series defined as the average of the BEST, HadCRUT4, and GISTEMP records. The purple line gives the 1986–2015 mean, with the shaded area representing ±1 SD. (B) The 99.9th percentiles of daily HI values, with values <27 °C masked (the lower limit of the HI warning category indicating “caution” to heat stress). (C) HI anomaly of 2015 relative to the mean of the annual maximums 1979–2015; negative anomalies are masked as are positive anomalies where absolute HI <27 °C. Note that the domain of C is indicated in B by the red box. (D) Daily mean HI values for the respective regions (1979–2015). Gray curves are individual years 1979–2014; red is 2015.

