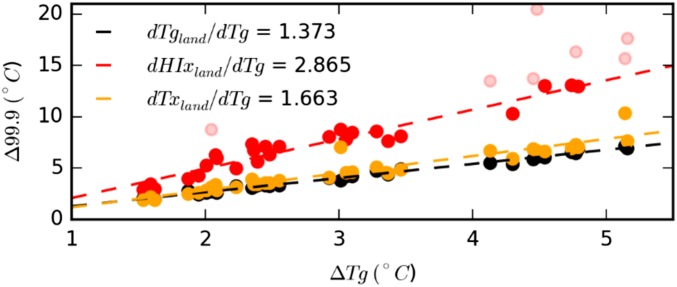
Fig. 2.
Relationship between CMIP5 modeled changes in global mean air temperature (ΔTg) and changes in mean air temperature over land (Tgland), extreme temperatures over land (Txland), and HI values over land (HIxland). Extremes are defined as the 99.9th percentile, and the changes are calculated by differencing the respective values in the last decade of model simulations (2090–2099) relative to the simulated values over the period 1979–1988. Note that we mask HI values >50 °C when computing the regression slope (shown in lighter shading), because this value is the upper limit of the range considered by ref. 8.

