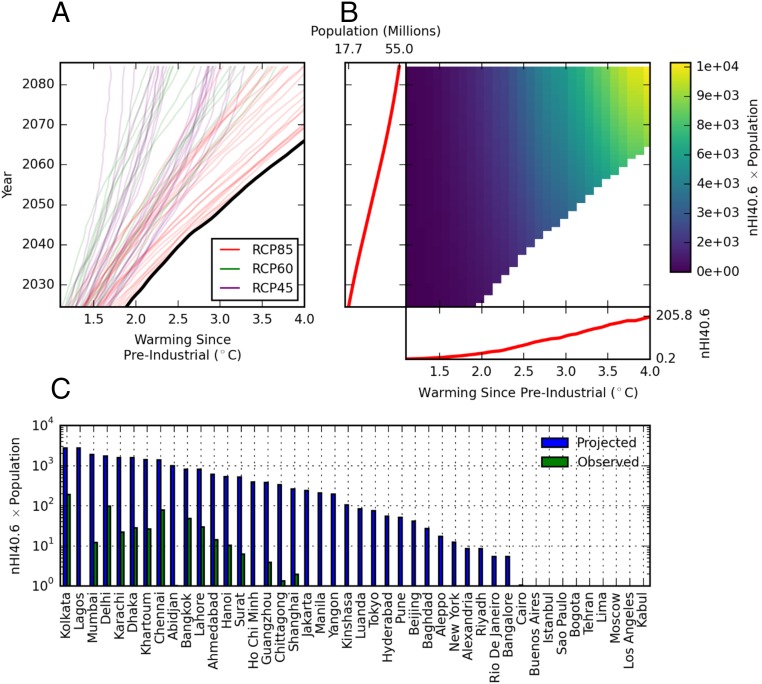
Fig. 5.
Population-weighted heat stress throughout the 21st century. (A) Running 30-y means of CMIP5 warming since PI. The fastest warming series is plotted with a heavy black line. Warming rates in excess of this are masked in B, which shows an example [for Lagos (Nigeria) under SSP2] of the ensemble median HSB for all other combinations of global warming amounts and running 30-y population averages; Insets attached to the respective axes show the evolution of the respective variables that are multiplied together to form the matrix. (C) The mean HSB projected over the 21st century across all SSP matrices for the respective cities. The reference HSB is computed using HI values for 1979–2005 along with the 1995 population estimate; details of these calculations are in Materials and Methods.

